Figures & data
Figure 1. Dysarthria subtypes for each neurodegenerative motor disease in the current review, their perceptual articulatory characteristics based on a widely used taxonomy of speech motor disorders (ordered from most severe to least severe, with * indicating more severely impaired than other dysarthria subtypes), and the corresponding areas of impairment based on our framework of articulatory components.
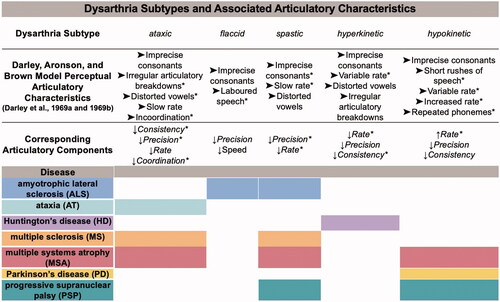
Figure 2. Definitions of the five framework components of articulatory motor and examples of acoustic features that represent each component.
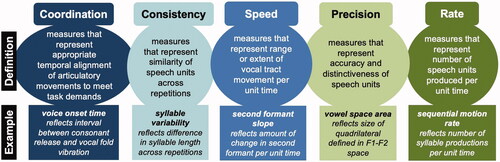
Figure 3. PRISMA chart illustrating the article search procedures and selection of included studies.
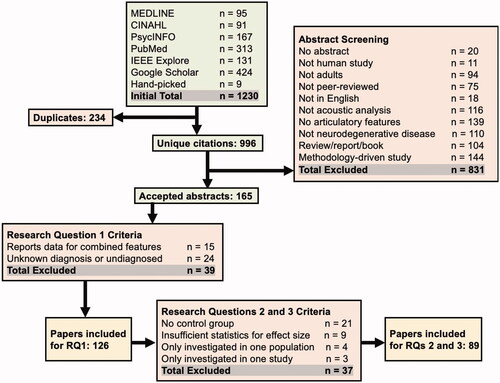
Table I. Demographics and clinical characteristics of participants across studies for RQ1 and RQs 2 and 3.
Figure 4. Pie chart illustrating the number of studies investigating each neurodegenerative motor disease. Studies were counted more than once if they investigated more than one disease. The number in parentheses represents the percentage of the 126 studies that investigated that specific disease.
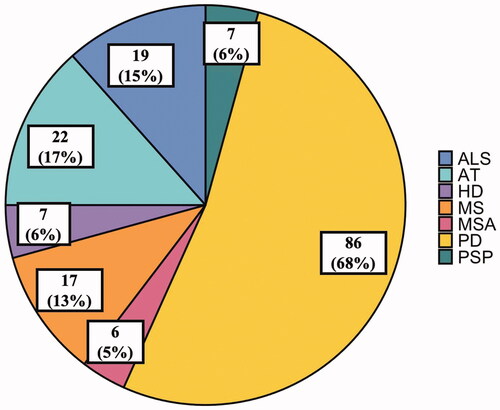
Figure 5. Bar graph illustrating the articulatory components investigated across all studies in individuals with neurodegenerative motor diseases. The frequency of features investigated in each disease is displayed in the corresponding box.
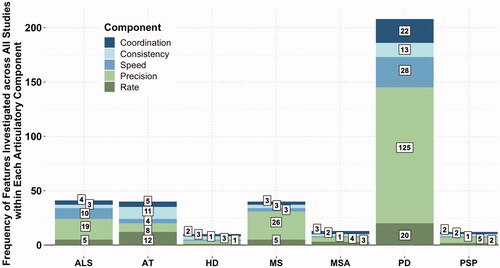
Figure 6. Forest plot illustrating effect sizes (disease group compared to healthy controls) for each articulatory feature. The number of participants investigated in each disease is displayed above the corresponding dot. The total number of participants across all diseases is displayed in brackets to the right of the features. Positive effect sizes indicate that the disease group exhibited poorer performance compared to controls, while negative effect sizes indicate that the disease group performed better than controls.
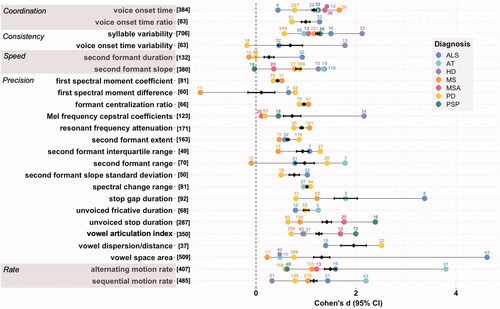
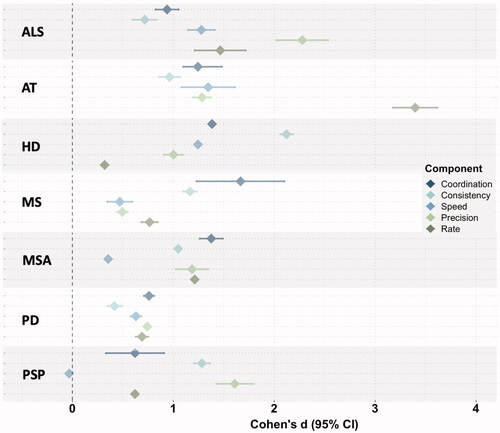
Figure 7. Forest plot illustrating divergent patterns of articulatory performance across neurodegenerative motor diseases. Each dot represents the mean effect size (disease group compared to healthy controls) for all acoustic features within each articulatory component.