
Figures & data
Table I. Clinician demographic and caseload information.
Figure 1. When speech-language pathologists initiate speech (n = 74) and swallowing (n = 90) intervention across the cancer treatment pathway.
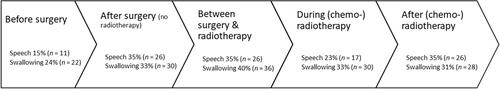
Table II. Speech and swallowing interventions.
Figure 2. Type and frequency of speech and swallowing interventions recommended. ROM = Range of motion.
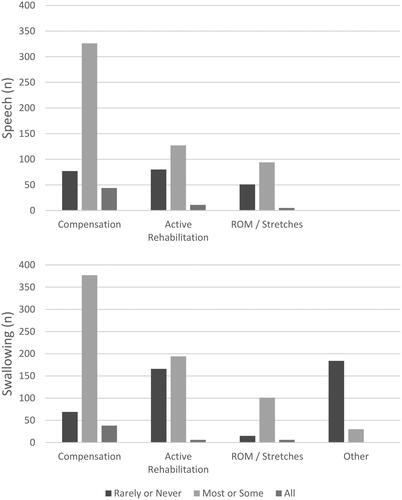
Table III. Frequency and intensity of speech and swallowing active rehabilitation.
Figure 3. Speech (n = 67) and swallowing (n = 75) outcome measures used by speech-language pathologists. QoL = Quality of Life.
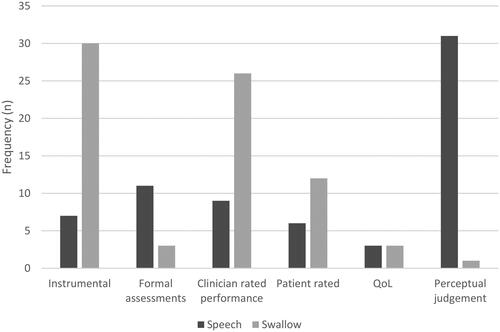
Figure 4. Main reasons for speech (n = 34) and swallowing (n = 39) service delivery.
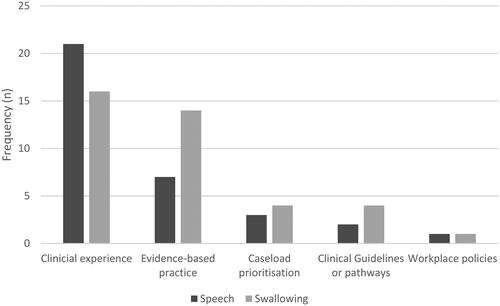
Figure 5. Sources of influence on choice of intervention (n = 212).
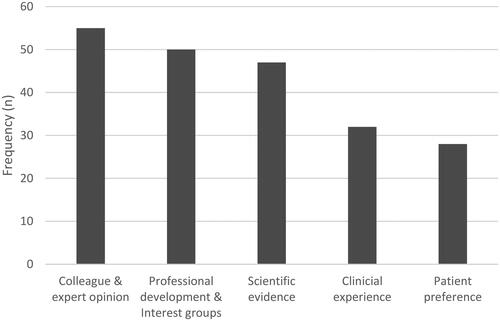
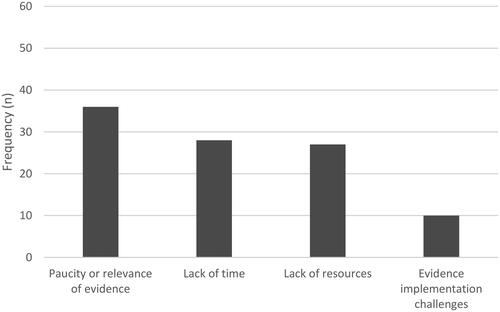
Figure 6. Perceived barriers to speech-language pathology service delivery (n = 101).
Supplementary Information - Survey Questions [abbreviated].pdf
Download PDF (481.9 KB)Data availability statement
The data that support the findings of this study are available on request from the corresponding author (KMB).