Figures & data
Figure 1. Light microscopy of a developing SCLC CTC-spheroid. Typical SCLC CTC in tissue culture appears as spheroid (A) which later shows outgrowth of adherent cells and shedding of cell fragments (B; left side shows border of the spheroid). Magnification: (A) 40fold and (B) 100fold.
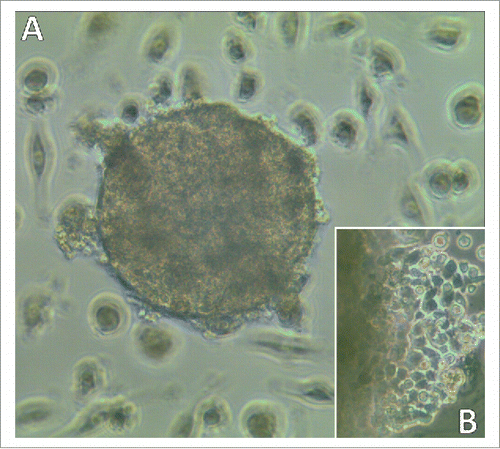
Figure 2. Expression of pluripotent stem cell markers by SCLC CTCs and cell lines. The figure shows the panel of pluripotent stem cell markers of 2 SCLC CTCs and several SCLC cell lines as determined by Western blot arrays. BHGc7 and BHGc10 together with GLC16 exhibited significantly higher expression of HNF-3β/FOXA2 compared to the other cell lines. Other markers included in this array, SOX17, α-fetoprotein, OCT-3/4, KDR, Otx2, GATA-4, Nanog, HCG, TP63 and Goosecoid showed no significant expression were not included here. Data for Vimentin were supplemented from ARY026 arrays.
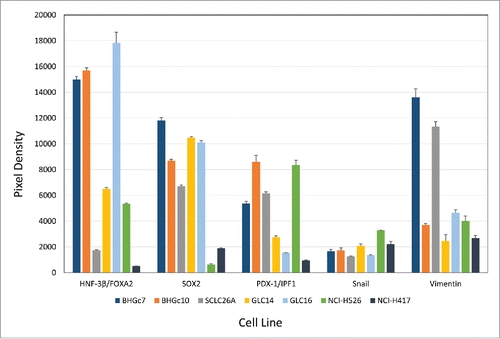
Figure 3. Flow cytometric analysis of E-cadherin and β-catenin expression. CTCs and cell lines were stained in indirect immunofluorescence for E-cadherin and β-catenin and values are presented as ratios of specific fluorescence signals with antibody to isotype controls (mean values of fluorescence maxima ± SD).
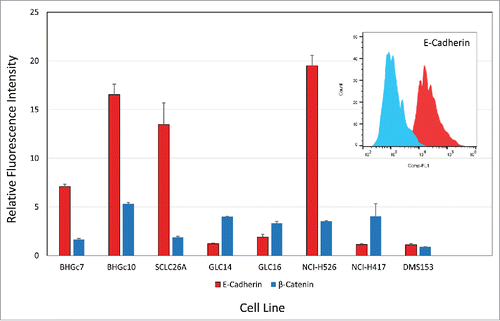
Figure 4. Light microscopy of a SCLC CTC tumorosphere. Adherent SCLC CTCs in tissue culture eventually start to form 3-dimensional structures under regular tissue culture conditions (A: BHGc10, left side of culture; magnification 100fold) which later grow into large tumorospheres (B: BHGc7, diameter of tumorosphere 560 µm; magnification 40fold). A large and irregular agglomeration of NCI-H526 cells in suspension is shown for comparison (C: magnification 40fold).
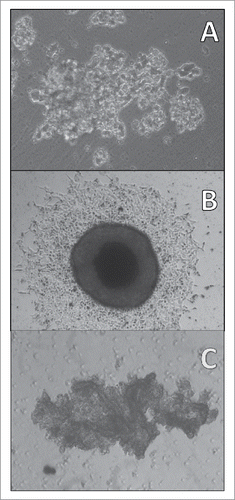
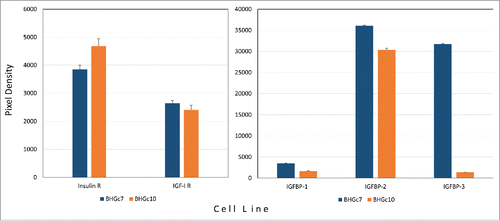
Figure 5. Expression of insulin/IGF growth circuit components by SCLC CTCs. Expression of insulin- and IGF1-receptors (A) as well as IGF binding proteins (B) by BHGc7 and BHGc10 as determined by Western blot arrays are shown as mean values ± SD. The two CTC cell lines as well as SCLC26A and NCI-H526 showed significantly higher expression of E-cadherin compared to the other cell lines.