Figures & data
Figure 1. CB1 receptor expression in U138, LN229 and U87 cell lines. (A) mRNA for hCB1 receptors is present in all cell lines. Cnr2-mRNA was found in U138 cells only. ß-actin was used as a house keeping gene. (B) Western Blot analysis as well as (C) immunohistochemical staining resulted in the confirmation of the presence of CB1 on the surface and in U138, LN229 and U87 cell lines.
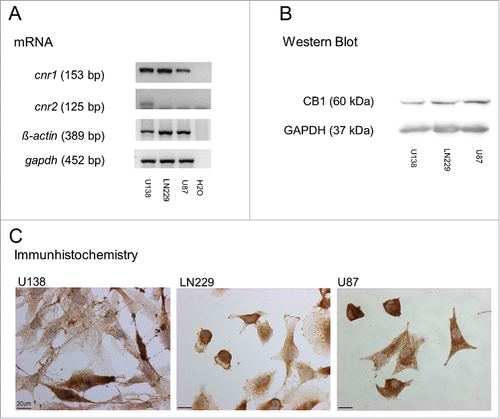
Figure 2. Results of the AFM and live cell imaging measurements for the 3 glioblastoma cell lines. (A) Shows the mean measured Young´s modulus with standard error of the mean (SEM) for each cell line and treatment. Statistical significance was achieved for treatments of U138 (nCTL = 60; nJWH-133 = 40; nACEA = 40) cells only. U87 (nCTL = 60; nJWH-133 = 60; nACEA = 40) and LN229 (nCTL = 60; nJWH-133 = 40; nACEA = 40) cells did not show a change in elasticity. No receptor/agonist specific effect could be observed. (B) Calculated mean adhesion energies to the cantilever via the DMT model. All treatments resulted in a decrease of the adhesiveness for all cell lines, except for U87 treated with ACEA. The numbers of analyzed cells used for determination of adhesion energy were identical to those for the Young´s modulus. (C) Derived speeds (mean ± SEM) from the time lapse images. One can observe diverse significant effects on the measured speed, with no apparent receptor/agonist specificity (U138: nCTL = 67, nJWH-133 = 81, nACEA = 78. For LN229: nCTL = 118, nJWH-133 = 177, nACEA = 57. For U87: nCTL = 158, nJWH-133 = 230, nACEA = 93.). (D) Mean area and SEM of each cell line treated with cannabinoids or as control measurement. The CB2 agonist led to a decrease of the area for U87 and LN229 cells but had no effect on the U138 cells. The CB1 agonist only resulted in a decrease of area for the U87 cells. No receptor/agonist specificity that holds for all cells could be observed. The numbers of experimental values for the cell area were identical to the ones for the cell speed. Statistics was performed using the Mann-Whitney test and significance was chosen for p < 0.05. The asterisk denotes significant results regarding the control measurement of the same cell line.
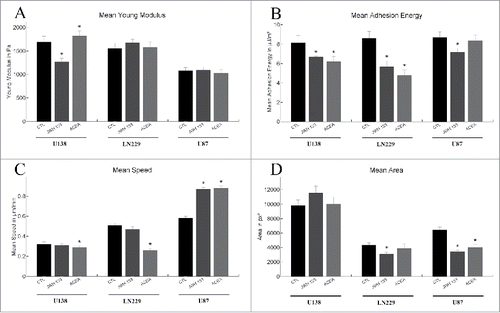
Figure 3. Measurement of the phosphorylation of focal adhesion kinases (FAK) for each cell line. (A) Top: No significant change of the phosphorylation ratio of FAK was observed for the used cells after 24 h of cannabinoid treatment (U138: nCTL = 4, nJWH133 = 4, nACEA = 4; LN229: nCTL = 5, nJWH133 = 5, nACEA = 5; U87: nCTL = 7, nJWH133 = 7, nACEA = 7). Values are given as mean with SEM. Bottom: representative Western Blots with pFAK, FAK and GAPDH. (B) Plot of the normalized adhesion energy and the normalized relative FAK phosphorylation. An increase in FAK phosphorylation is associated with an increase in normalized adhesion energy, with a spearman correlation coefficient r = 0.90.
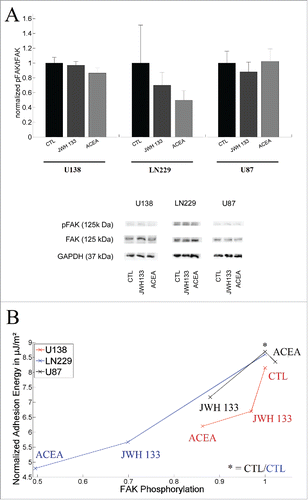
Figure 4. Measurements of the invasion for each cell line and its respective treatment. (A) In U138 cells a significant increase in invasiveness was seen 3 and 4 d after treatment with the CB2 agonist JWH-133 (n3d CTL = 39, n3d JWH133 = 22, n4d CTL = 26, n4d JWH133 = 18). ACEA application resulted in a decrease of invasiveness after 3 d of invasion time but the effect was not significant anymore after 4 d (n3d ACEA = 20, n4d ACEA = 18). (B) Under influence of JWH-133 a significant decrease of invasiveness of LN229 cells was observed after 3 and 4 d (n3d CTL = 37, n3d JWH133 = 19, n4d CTL = 41, n4d JWH133 = 21). ACEA did not have a significant influence on LN229 cells (n3d ACEA = 24, n4d ACEA = 22). (C) Displays the obtained results for the U87 cells under influence of cannabinoids. Neither the CB1 nor CB2 agonist could show any significant effect (n3d CTL = 53, n3d JWH133 = 25, n3d ACEA = 26, n4d CTL = 51, n4d JWH133 = 21, n4d ACEA = 30). (D) Represents a typical invasion pattern generated by the tumor cells after 4 d of invasion. In red the propidium iodide dyed cytoarchitecture of the OHSC is visible, while green depicts the tumor labeled using carboxyfluorescin diacetate. Clear distinguishable structures allowing differentiation between single tumors are not visible. Scale bars depict 400 µm. Statistics was performed using the Mann-Whitney test and significance was chosen for p < 0.05. The asterisk denotes significant results regarding the control measurement of the same cell line.
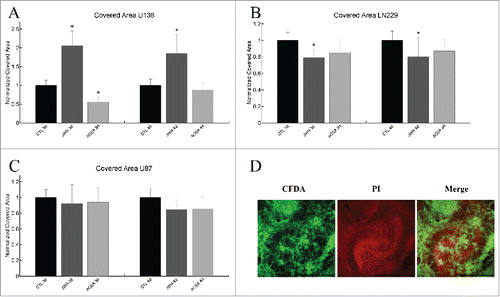
Figure 5. Scheme of the network analysis results. Vertices are depicted as circles, while edges between vertices are shown as lines connecting vertices. The numbers and letters represent the respective parameters listed on the right. (A) List of parameters extracted from the time lapse image. (B) List of parameters extracted from the atomic force microscopy measurements.
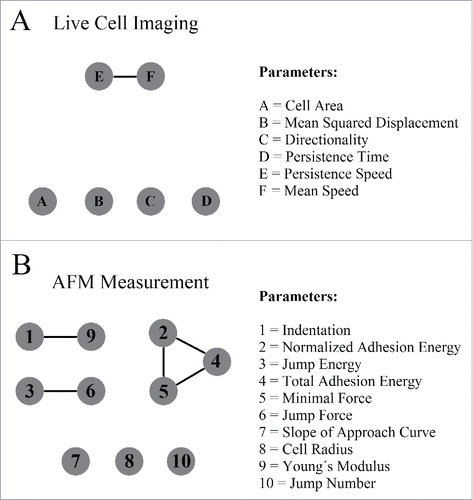
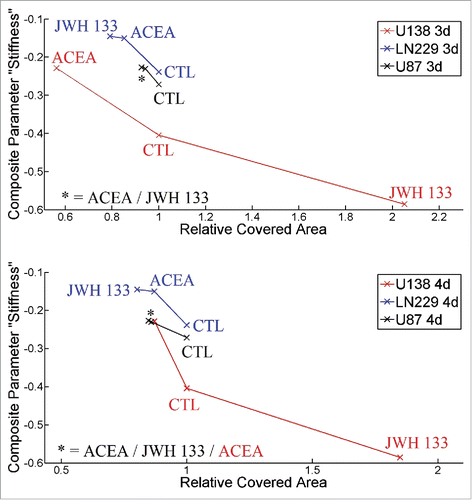
Figure 6. Plot of the composite parameter “stiffness” versus the invasiveness after 3 (top) or 4 (bottom) days of invasion time. One can see that a decrease in the parameter “stiffness” is strongly correlated with an increase in invasiveness for all cell types and treatments. The respective spearman correlation coefficient is r3d = 0.88 for 3 d of invasion time and r4d = 0.90 for 4 d of invasion time.