
Figures & data
Figure 1. Molecular structure of KATP channels. (a) genes encoding SUR1 and Kir6.2. (b) genes encoding SUR2 (A/B) and Kir6.1. (c) topology of SUR and Kir6 proteins. Note the arginine-based ER retention motif is RKR in SUR1, Kir6.1, and Kir6.2, but RKQ in SUR2A/SUR2B. (d) CryoEM reconstruction of the Kir6.2/SUR1 KATP channel viewed from the side (left) and from the bottom (intracellularly) (right). (e) structural model of the Kir6.2/SUR1 KATP channel from the cryoEM reconstruction shown in (d), viewed from the side (left; only two SUR1 subunits are shown for clarity) and from the top (extracellularly) (right). Panels (d) and (e) are adapted from in Martin et al. eLife, 2017 [Citation28].
![Figure 1. Molecular structure of KATP channels. (a) genes encoding SUR1 and Kir6.2. (b) genes encoding SUR2 (A/B) and Kir6.1. (c) topology of SUR and Kir6 proteins. Note the arginine-based ER retention motif is RKR in SUR1, Kir6.1, and Kir6.2, but RKQ in SUR2A/SUR2B. (d) CryoEM reconstruction of the Kir6.2/SUR1 KATP channel viewed from the side (left) and from the bottom (intracellularly) (right). (e) structural model of the Kir6.2/SUR1 KATP channel from the cryoEM reconstruction shown in (d), viewed from the side (left; only two SUR1 subunits are shown for clarity) and from the top (extracellularly) (right). Panels (d) and (e) are adapted from Figure 2 in Martin et al. eLife, 2017 [Citation28].](/cms/asset/7bef8c34-14ed-49da-8b37-e0fed738c8bf/kchl_a_2327708_f0001_oc.jpg)
Figure 2. ATP- and Repaglinide (RPG)-bound SUR1/Kir6.2 structure (PDB ID 7TYS; EMD-26193). (a) side and (b) bottom (cytoplasmic) views showing the ATP (cryoEM map shown in orange, 3 σ contour) binding site coordinated by Kir6.2 residues from the N-terminus of one subunit and the C-terminus of an adjacent subunit, as well as L0 of the SUR1 subunit directly in association with the Kir6.2 subunit whose N-terminus contributes to ATP binding. Repaglinide (RPG; cryoEM map shown in purple, 1 σ contour) is bound in a transmembrane pocket in SUR1. The N-terminal peptide of Kir6.2 (KNtp; cryoEM density in green mesh, 1 σ contour) is inserted into the cavity of the two halves of the SUR1-ABC core with the very N-terminus adjacent to the bound RPG.
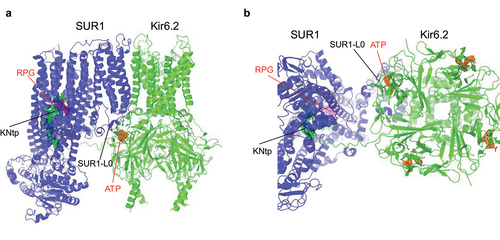
Figure 3. PIP2-bound open SUR1/Kir6.2Q52R channel structure. (a) CryoEM map features of two PIP2 molecules colored in magenta and cyan (0.08 V, 4 σ contour), respectively. (b) structural model of the PIP2 binding pocket (red boxed region in (a)) viewed from the side. Residues from both Kir6.2 (adjacent subunit denoted “b”) and SUR1 (blue outline) surrounding bound PIP2 molecules are labeled. (c) comparison of the SUR1-Kir6.2 cytoplasm-plasma membrane interface between open PIP2 (cyan and magenta sticks)-bound SUR1/Kir6.2Q52R (SUR1 in teal and Kir6.2 in yellow) KATP channel and closed ATP-(orange phosphate and gray carbon sticks) and repaglinide (out of view)-bound SUR1/Kir6.2 (SUR1 in pink and Kir6.2 in gray) KATP channel (PDB ID 7TYS) viewed from the extracellular side. Reorientation of side chains of the Kir6.2 inner helix gate residue F168 and M1 residue F60 in the two conformations is shown. A 6.4° clockwise rotation of the Kir6.2-CTD is indicated by the magenta curved arrow (with D323 Cα in each structure marked as spheres). Reorientation of the side chain of W51 at the bottom of TM1 of SUR1-TMD0 is evident. SUR1-L0, marked by the ATP-binding residue K205 and an adjacent residue E203, moves away from the ATP binding pocket (magenta arrow) in the open conformation. Panels (a) and (b) are taken from , and panel (c) from of bioRxiv preprint by Driggers et al.. (reference [Citation21]).
![Figure 3. PIP2-bound open SUR1/Kir6.2Q52R channel structure. (a) CryoEM map features of two PIP2 molecules colored in magenta and cyan (0.08 V, 4 σ contour), respectively. (b) structural model of the PIP2 binding pocket (red boxed region in (a)) viewed from the side. Residues from both Kir6.2 (adjacent subunit denoted “b”) and SUR1 (blue outline) surrounding bound PIP2 molecules are labeled. (c) comparison of the SUR1-Kir6.2 cytoplasm-plasma membrane interface between open PIP2 (cyan and magenta sticks)-bound SUR1/Kir6.2Q52R (SUR1 in teal and Kir6.2 in yellow) KATP channel and closed ATP-(orange phosphate and gray carbon sticks) and repaglinide (out of view)-bound SUR1/Kir6.2 (SUR1 in pink and Kir6.2 in gray) KATP channel (PDB ID 7TYS) viewed from the extracellular side. Reorientation of side chains of the Kir6.2 inner helix gate residue F168 and M1 residue F60 in the two conformations is shown. A 6.4° clockwise rotation of the Kir6.2-CTD is indicated by the magenta curved arrow (with D323 Cα in each structure marked as spheres). Reorientation of the side chain of W51 at the bottom of TM1 of SUR1-TMD0 is evident. SUR1-L0, marked by the ATP-binding residue K205 and an adjacent residue E203, moves away from the ATP binding pocket (magenta arrow) in the open conformation. Panels (a) and (b) are taken from Figure 2, and panel (c) from Figure 4 of bioRxiv preprint by Driggers et al.. (reference [Citation21]).](/cms/asset/f65f1a68-2fc7-4352-bc95-b8534461759b/kchl_a_2327708_f0003_oc.jpg)
Figure 4. Molecular structure of KATP channels. (a) view of the inhibitory ATP binding site on Kir6.2 (light green) (PDB ID 6BAA) with ATP bound, in a closed pore conformation, with SUR1 (teal) subunits shown. (b) the same view of the pre-open Kir6.2 pore (dark green) (PDB ID 7W4O; pre-open SUR1-Kir6.2H175K fusion) with the inhibitory ATP pocket empty. The ATP-binding pocket is enlarged due to outward movement of SUR1 (blue) L0, and Kir6.2 CTD rotation. Note two other open structures: SUR1/Kir6.2C166S, G334D (PDB ID 7S5X) and PIP2-bound SUR1/Kir6.2Q52R (preprint in bioRxiv, reference [Citation21]) are very similar in Kir6.2-CTD rotation and pore opening, the movement of SUR1-L0 away from Kir6.2, and the enlargement of the ATP binding pocket.
![Figure 4. Molecular structure of KATP channels. (a) view of the inhibitory ATP binding site on Kir6.2 (light green) (PDB ID 6BAA) with ATP bound, in a closed pore conformation, with SUR1 (teal) subunits shown. (b) the same view of the pre-open Kir6.2 pore (dark green) (PDB ID 7W4O; pre-open SUR1-Kir6.2H175K fusion) with the inhibitory ATP pocket empty. The ATP-binding pocket is enlarged due to outward movement of SUR1 (blue) L0, and Kir6.2 CTD rotation. Note two other open structures: SUR1/Kir6.2C166S, G334D (PDB ID 7S5X) and PIP2-bound SUR1/Kir6.2Q52R (preprint in bioRxiv, reference [Citation21]) are very similar in Kir6.2-CTD rotation and pore opening, the movement of SUR1-L0 away from Kir6.2, and the enlargement of the ATP binding pocket.](/cms/asset/57dca35e-3fcd-4cf6-91c6-7b5079fec736/kchl_a_2327708_f0004_oc.jpg)
Figure 5. Nucleotide regulation of KATP channels. Cartoon illustrating key structural differences between KATP channels bound to inhibitory ATP in closed conformation (left) and KATP channels in open conformation, with SUR1 NBD1/2 bound to MgATP/MgADP and dimerized (right). The PIP2 binding pocket in the SUR1 NBD-dimerized open conformation would accommodate the binding of two PIP2 molecules at the SUR1-Kir6.2 interface.
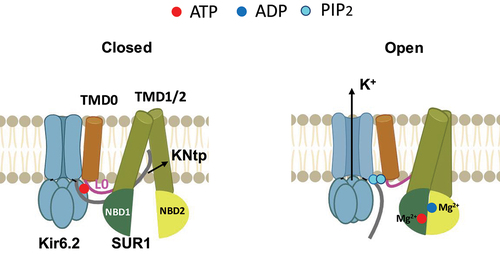
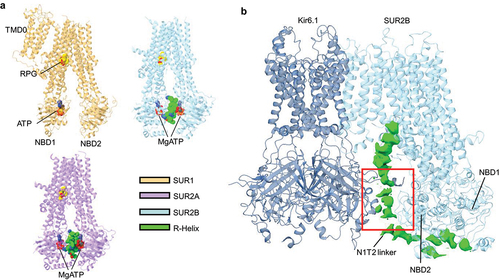
Figure 6. Structural elements implicated in MgADP regulation of KATP channels. (a) cartoon representation of the structures of either SUR1 (orange) (PDB ID 6JB1), SUR2A (purple) (PDB ID 7Y1J), or SUR2B (blue) (PDB ID 7Y1L) with the regulatory helix (R-Helix) shown as spheres (green). ATP (red spheres) and RPG (yellow spheres) are also shown. (b) overall structure of Kir6.1 (navy) plus one single SUR2B subunit (blue) in the quatrefoil like conformation (PDB ID 7MJO) showing the NBD1-TMD2 (N1T2) linker cryoEM density (green) in between SUR2B NBD2 and Kir6.1-CTD. Red boxed region is the approximate location of the ED domain.
Data availability statement
Data sharing is not applicable to this article as no new data were created or analyzed in this study.