Figures & data
Daily Water Consumption and Hg Ingestion in Rats that Received Sublethal Doses of Mercuric Chloride by Oral Route†
Body Weight and Relationships between the Male Reproductive Organ Weights and Body Weight in Rats that Received Sublethal Doses of Mercuric Chloride by Oral Route†
Figure 1 Mercury concentrations in testis, epididymis or serum from rats that received sublethal doses of the metal by oral route. ▪ Control rats; ▴ Rats that received 0.01 μg/ml of Hg; • Rats that received 0.05 μg/ml of Hg; ♦ Rats that received 0.1 μg/ml of Hg. (A) Testis; (B) Epididymis; and (C) Serum.
Figure 2 Effects of the oral administration of Hg on testis morphology. (A) Microphotography of a tissue section from a control rat receiving deionized water (HE, 160X). (B) Cohesion loss in tubular cells (asterisks) and (C) Luminal obliteration (asterisks) in sections of rats that received 0.05 μg/ml of Hg for 1 month (HE, 250X). (D) Arrest at the spermatocyte stage (asterisks) and (E) Multinucleated giant cells in sections from rats that received 0.05 μg/ml of Hg for 2 months (HE, 100X, 400X). (F) Tubular atrophy in a section from a rat that received 0.1 μg/ml of Hg for 3 months (VG, 400X).
Severity of Lesions in Seminiferous Tubules from Rats that Received Mercuric Chloride by Oral Route
Figure 3 Effects of the oral administration of Hg on epididymis morphology. (A) Microphotography of a tissue section from a control rat that only received deionized water (VG, 250X). (B) Tissue section from a rat that received 0.01 μg/ml of Hg for 1 month, showing peritubular cell dissociation (arrows) (Iron H, 400X). (C) Tissue section from a rat that received 0.01 μg/ml of Hg for 3 months showing multinucleated giant cells (arrows) (Iron H, 400X).
Figure 4 Effects of the oral administration of Hg on the ultrastucture of testis. (A) Microphotography of a tissue section from a control rat that only received deionized water. N: Sertoli cell nucleus, Lys: lysosome, m: mitochondria, tw: tubular wall (6000X). (B) Damaged mitochondria (asterisks) (11500X), (C) Increased number of secondary lysosomes (arrows) and Golgi dilation (asterisks) in sections from rats that received 0.05 μg/ml of Hg for 3 months (5200X).
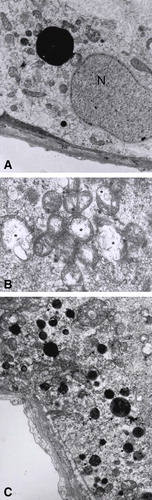
Figure 5 Leydig cell alteration in testis from rats that received Hg by oral route. (A) Microphotography of a tissue section from a control rat that only received deionized water. N: nucleus, m: mitochondria (arrows) (2950X). (B) Section from a rat treated with 0.05 μg/ml of Hg for 3 months showing peroxisomes (p), secondary lysosomes (ly) damaged mitochondria (m) and dilated endoplasmic reticulum (arrows) (6600X).
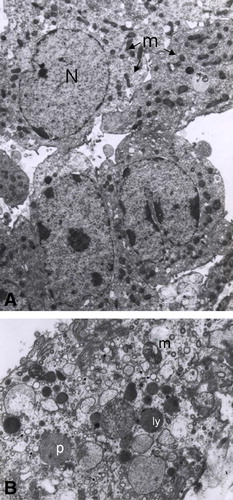
Figure 6 Effects of the oral administration of Hg on the ultrastucture of epididymis. (A) Myelinic figures (arrows) and (B) Crystal deposits in lysosomes of principal cells (arrows) from rats treated with 0.05 μg/ml of Hg for 3 months (6600X each).
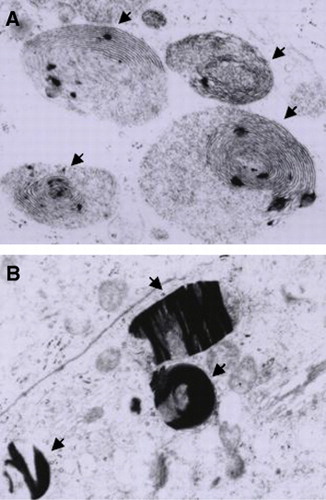
Figure 7 Effects of the oral administration of sublethal doses of Hg on IFN-γ and IL-4 serum levels. Pooled results obtained from animals treated with mercury for different times.
Figure 8 Changes in IFN-γ serum levels in rats that received sublethal doses of Hg by oral route.