Figures & data
Table 1. Patients’ characteristics and oocytes survival rates by groups.
Figure 1. Spindle (green) configuration and chromosomal (blue) alignment in human MII oocytes. (A1-3) Representative normal spindle and chromosomal configuration in human MII oocytes in the 37°C group; (B1-3 and C1-3) representative abnormal spindle and chromosomal configuration in the RT group. Arrows indicate the spindle multipoles and displaced chromosomes. Scale bar = 10 µm. MII: metaphase II; RT: room temperature.
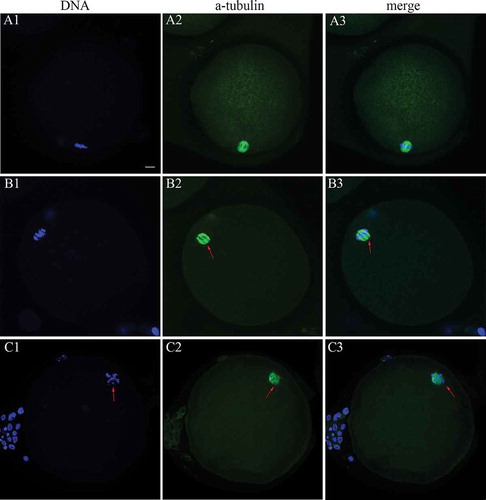
Figure 2. Abnormal spindle, abnormal chromosome, and diffuse mitochondrial distribution rate in the two groups. (A) Representative abnormal spindle rate; (B) representative abnormal chromosome rate; (C) representative diffuse mitochondria rate. The proportion of spindle and abnormal chromosome in the 37°C group was significantly lower than that in the RT group. * indicates p < 0.05; RT: room temperature.
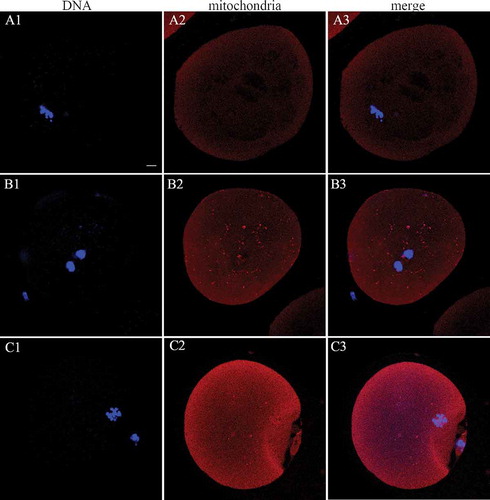
Figure 3. Mitochondrial (red) distribution in human MII oocytes. (A1-3) Peripheral mitochondrial distribution in the MII phase human oocytes in the 37°C group; (B1-3 and C1-3) semiperipheral and diffuse mitochondrial distribution in the RT group, respectively. Scale bar = 10 µm. MII: metaphase II; GV: germinal vesicle; RT: room temperature.