
Figures & data
Table 1. Summary of literatures pertaining to bus arrival prediction.
Figure 1. Data collection scheme in the study area.
Figure 2. Bus route in the city.
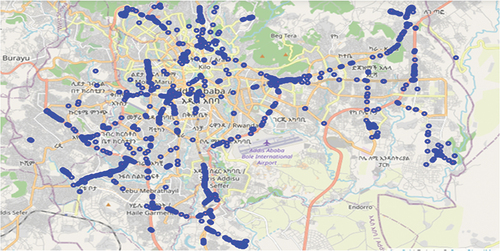
Table 2. Description of the selected features.
Figure 3. Feature correlation (heat map).
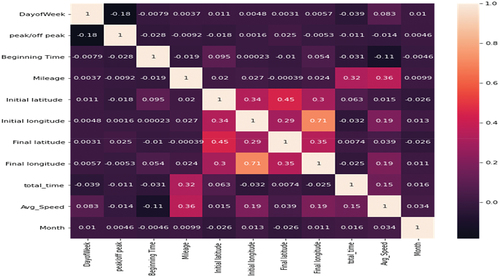
Figure 4. Proposed machine learning model.
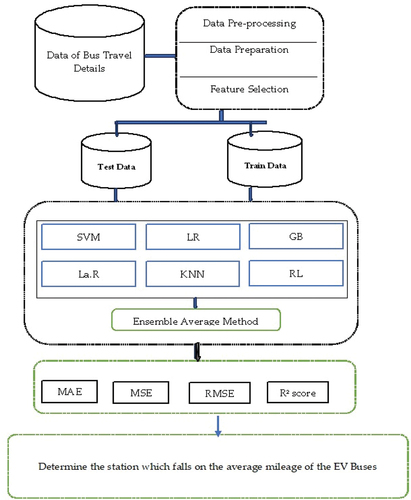
Table 3. Description of charging point selection steps.
Figure 5. Dataset after adding average speed.
Figure 6. Dataset after distance calculation.
Figure 7. Bus trip locations.
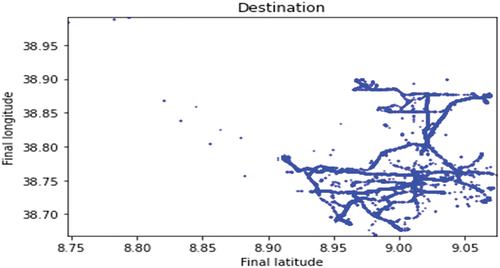
Figure 8. Bus trip routes.
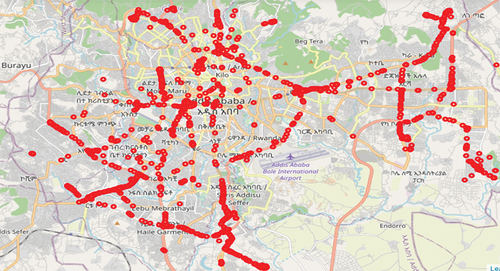
Table 4. Execution time, R2 score, MAE, MSE and RMSE of each Model.
Figure 9. Comparison of models’ performances.
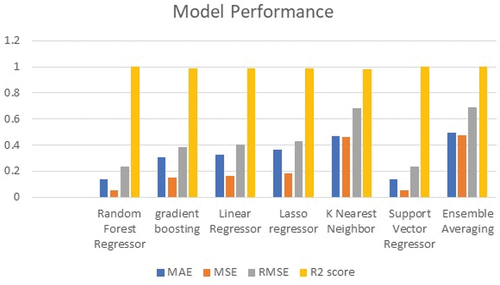
Figure 10. Model testing result.
Figure 11. Predicted and actual values of different models.
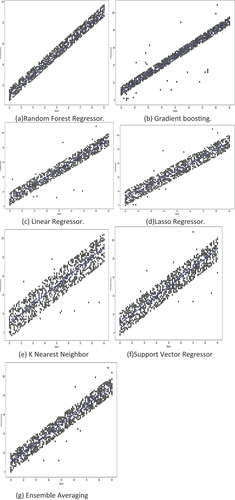
Table 5. Linear regression analysis of the individual models.
Figure 12. Variables and their SHAP values of the random forest model.
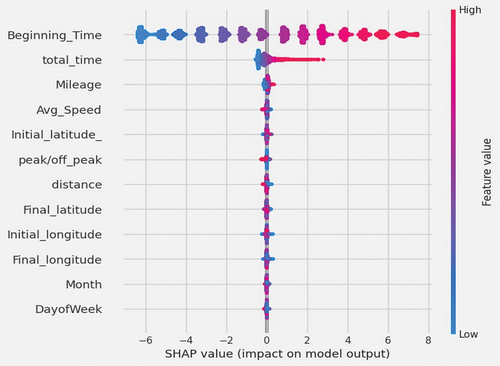
Figure 13. Bus routes according to their final coordinates.
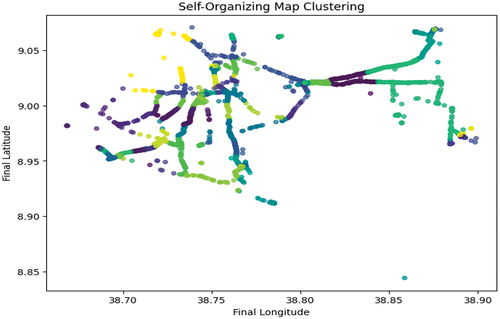
Figure 14. Maps according to possible cluster of the data for bus routes.
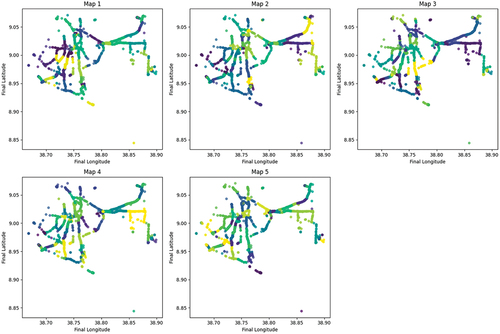
Figure 15. Possible locations for EV charging stations according to SOM.
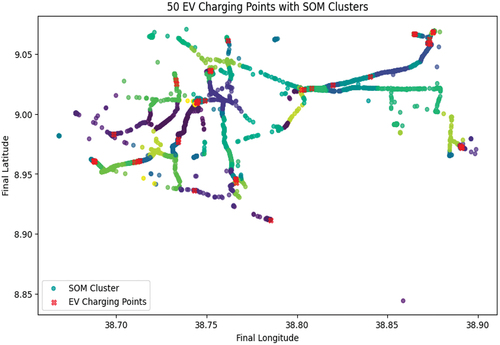
Figure 16. Comparative clustering performances.
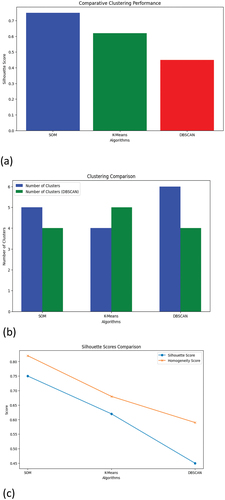
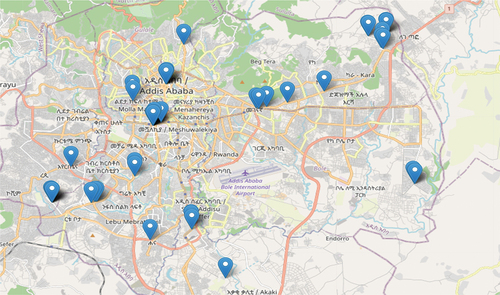
Figure 17. Optimal EV charging point locations in the map of Addis Ababa.
Data availability statement
The data that support the findings of this study are available from the corresponding author, T.K.Das, upon reasonable request.