Figures & data
FIGURE 1. Predicted changes in species distributional overlap for three different hypotheses. The upper-left panel represents changes in overlap given that spatial distribution expands as abundance increases (basin model hypothesis). The lower-left panel illustrates how overlap would change as individuals join mixed schools at lower population levels (school trap hypothesis). The righthand panels illustrate how overlap could change as environmental and climatological conditions change (thermal niche hypothesis); curves illustrate the corresponding habitat shifts expected for species x and species y (dashed lines represent original habitats; solid lines indicate habitat shifts resulting from changing environmental conditions). Environmental changes could cause expansion of habitat niches (decreasing overlap) or could lead to a decrease or shift in current niches; overlap would also change if phenological response rates to changing environmental conditions differ between the species.
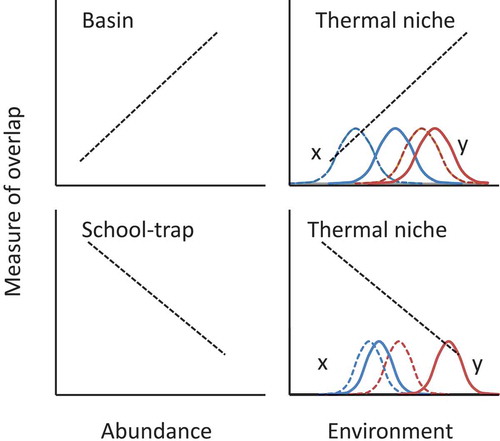
FIGURE 2. Map of the northeastern U.S. continental shelf, indicating the regions that were surveyed by the Northeast Fisheries Science Center (GOM = Gulf of Maine; GB = Georges Bank; SNE = southern New England; MAB = Mid-Atlantic Bight).
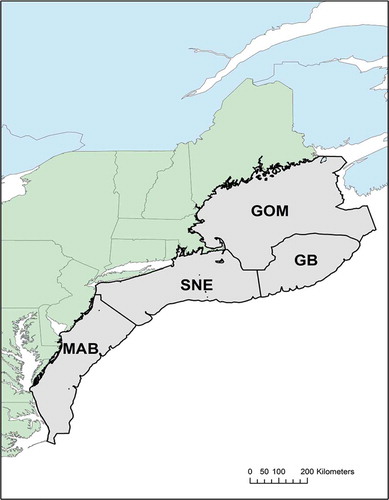
TABLE 1. Summary of beta regression models for changes in Bray–Curtis similarity indices for species overlap observed during the Northeast Fisheries Science Center’s fall bottom trawl survey (AW = Alewife; BB = Blueback Herring; AH = Atlantic Herring; AM = Atlantic Mackerel). Each region (GOM = Gulf of Maine; GB = Georges Bank; SNE = southern New England) was modeled separately (the independent variable was year). Data from the Mid-Atlantic Bight are omitted here (as were select other models) because there were few Alewife and Blueback Herring observations. The phi coefficient reflects the variance of the response, and the direction of significant (P < 0.05) trends is noted.
FIGURE 3. Bar chart showing the number of Bray–Curtis similarity indices of species overlap combinations that significantly increased, significantly decreased, or showed no significant changes throughout the time series for each region (GOM = Gulf of Maine; GB = Georges Bank; SNE = southern New England; MAB = Mid-Atlantic Bight) and each season (fall or spring).
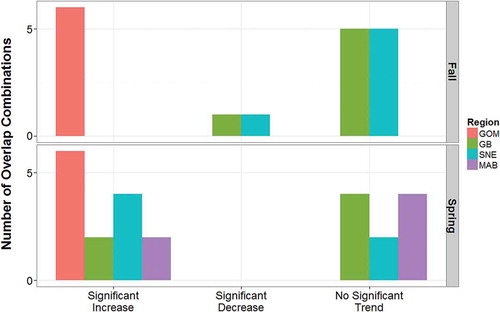
TABLE 2. Summary of beta regression models for changes in Bray–Curtis similarity indices for species overlap observed during the Northeast Fisheries Science Center’s spring bottom trawl survey (AW = Alewife; BB = Blueback Herring; AH = Atlantic Herring; AM = Atlantic Mackerel). Each region (GOM = Gulf of Maine; GB = Georges Bank; SNE = southern New England; MAB = Mid-Atlantic Bight) was modeled separately (independent variable was year; overlap combinations with fewer than five observations were not modeled). The phi coefficient reflects the variance of the response, and the direction of significant (P < 0.05) trends is noted.
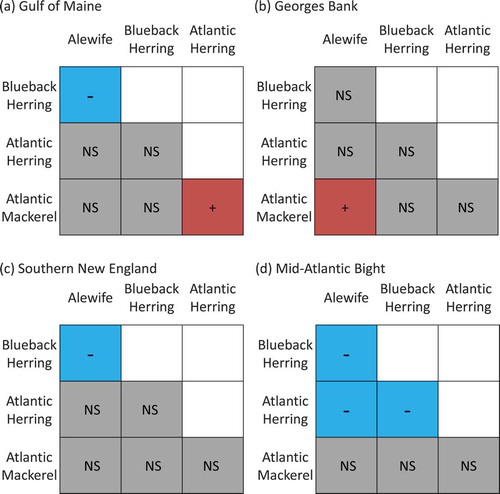
FIGURE 4. Raster diagrams illustrating the effects of species abundances on overlap observed during the Northeast Fisheries Science Center’s fall bottom trawl survey in (a) the Gulf of Maine, (b) Georges Bank, and (c) southern New England (red, + = positive effect; blue, – = negative effect; gray, NS = no significant effect). (No abundance effects were observed in the Gulf of Maine; negligible overlap was observed in the Mid-Atlantic Bight.)
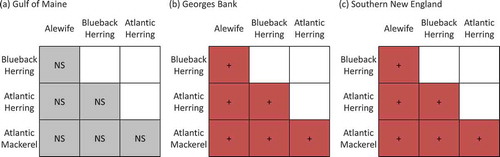
FIGURE 5. Raster diagrams illustrating the effects of bottom temperature on overlap observed during the Northeast Fisheries Science Center’s fall bottom trawl survey in (a) the Gulf of Maine, (b) Georges Bank, and (c) southern New England (red, + = positive effect; blue, – = negative effect; gray, NS = no significant effect). (Negligible overlap was observed in the Mid-Atlantic Bight.)
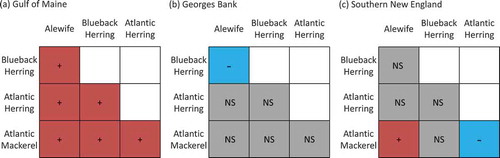
FIGURE 6. Raster diagrams illustrating the effects of species abundances on overlap observed during the Northeast Fisheries Science Center’s spring bottom trawl survey in (a) the Gulf of Maine, (b) Georges Bank, (c) southern New England, and (d) the Mid-Atlantic Bight (red, + = positive effect; blue, – = negative effect; gray, NS = no significant effect).
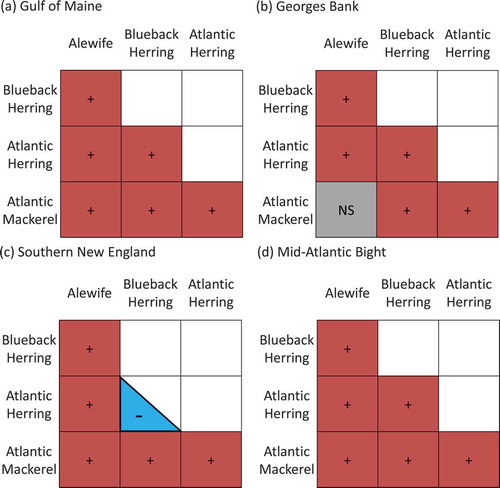
FIGURE 7. Raster diagrams illustrating the effects of bottom temperature on overlap observed during the Northeast Fisheries Science Center’s spring bottom trawl survey in (a) the Gulf of Maine, (b) Georges Bank, (c) southern New England, and (d) the Mid-Atlantic Bight (red, + = positive effect; blue, – = negative effect; gray, NS = no significant effect).