Figures & data
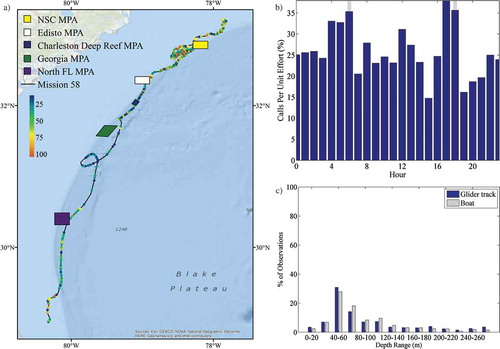
FIGURE 1. Location of autonomous glider deployment off the southeastern U.S. coast in relation to (a) marine protected areas (MPAs; the Northern South Carolina [NSC] MPA, Edisto MPA, Charleston Deep Reef MPA, Georgia MPA, and North Florida [North FL] MPA) and (b) the Gulf Stream. The glider was deployed off Cape Canaveral, Florida, on March 3, 2014, and was recovered off Cape Fear, North Carolina, on April 1, 2014. The red box within the inset in panel (a) illustrates the location of the study area at a broader scale. The black line in both images depicts the location of the glider track.
![FIGURE 1. Location of autonomous glider deployment off the southeastern U.S. coast in relation to (a) marine protected areas (MPAs; the Northern South Carolina [NSC] MPA, Edisto MPA, Charleston Deep Reef MPA, Georgia MPA, and North Florida [North FL] MPA) and (b) the Gulf Stream. The glider was deployed off Cape Canaveral, Florida, on March 3, 2014, and was recovered off Cape Fear, North Carolina, on April 1, 2014. The red box within the inset in panel (a) illustrates the location of the study area at a broader scale. The black line in both images depicts the location of the glider track.](/cms/asset/793d78e6-83cd-4627-ba7f-f14828a8928e/umcf_a_1255685_f0001_oc.jpg)
FIGURE 2. Composite spectrogram, showing the band sound pressure level (dB referenced to 1 μPa; 100-Hz resolution) up to 2 kHz, with four date marks (all dates are from 2014; upper panel); and the corresponding position of the autonomous glider along the southeastern U.S. coast on those dates (lower panels). The yellow symbol in the lower panels represents the glider; the direction the icon is facing indicates the glider’s heading. The white flags represent waypoints that were used to navigate the glider during the mission.
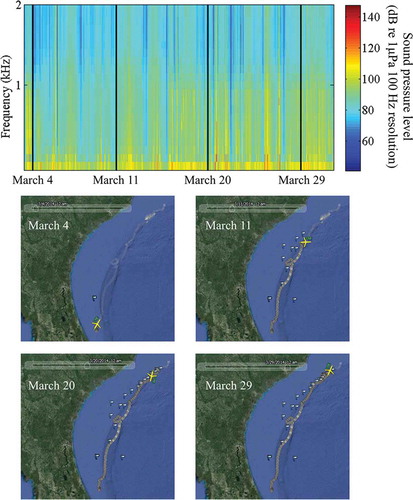
TABLE 1. Number (N) and percentage of 30-s files that were observed to contain specific sounds; the mean, SD, and range of bottom depths when those sounds were recorded by the autonomous glider; and the percentage of detections that were recorded during daytime hours.
FIGURE 3. (a) Locations of acoustic files that contained Red Grouper sounds across the entire glider track (red circles; N = 120); (b) locations of those same files zoomed in to the northern portion of the track and binned as a percentage of 30-s files per hour; (c) percentage of 30-s files containing Red Grouper sounds normalized by the total number of files that were recorded during each hour (gray bars indicate local sunrise and sunset); and (d) percentage of Red Grouper observations and the overall glider track present within 20-m bottom depth intervals. Site abbreviations used in panels (a) and (b) are defined in .
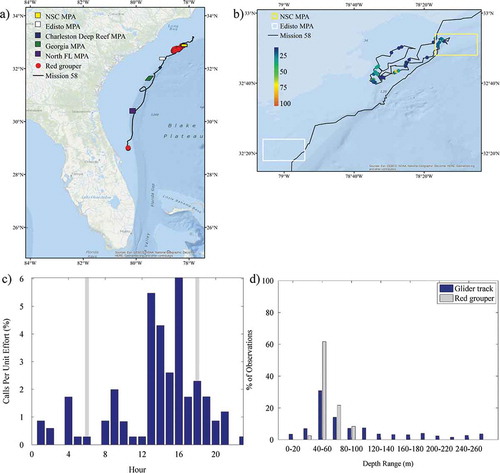
FIGURE 4. Locations of Red Grouper caught in traps (green circles) in southeastern U.S. waters off the South Carolina coast; and locations of Red Grouper sounds recorded by the autonomous glider (red circles). Trap data are from the Southeast Reef Fish Survey (SERFS; see Methods for details).
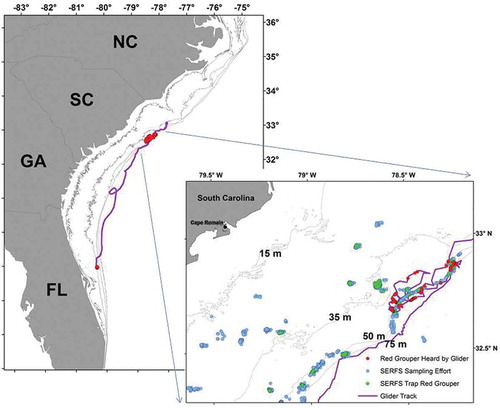
FIGURE 5. (a) Location of acoustic files that contained toadfish sounds across the entire glider track (red circles; N = 4); (b) percentage of 30-s files containing toadfish sound production normalized by the total number of files that were recorded during each hour (gray bars indicate local sunrise and sunset); and (c) percentage of toadfish observations and the overall glider track present within 20-m bottom depth intervals. Site abbreviations used in panel (a) are defined in .
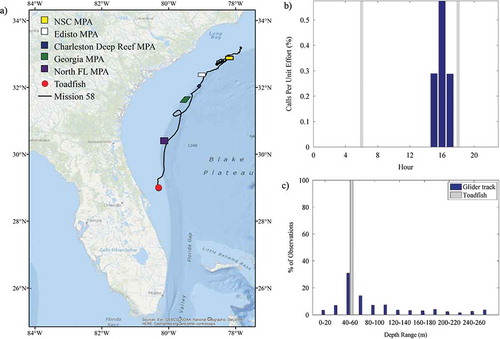
FIGURE 6. (a) Locations of acoustic files that contained 300-Hz FM harmonic sounds across the entire glider track (red circles; N = 70); (b) locations of those same files zoomed in to the northern portion of the track and binned as a percentage of 30-s files per hour; (c) percentage of 30-s files containing 300-Hz FM harmonic sound production normalized by the total number of files that were recorded during each hour (gray bars indicate local sunrise and sunset); and (d) percentage of 300-Hz FM harmonic observations and the overall glider track present within 20-m bottom depth intervals. Site abbreviations used in panels (a) and (b) are defined in .
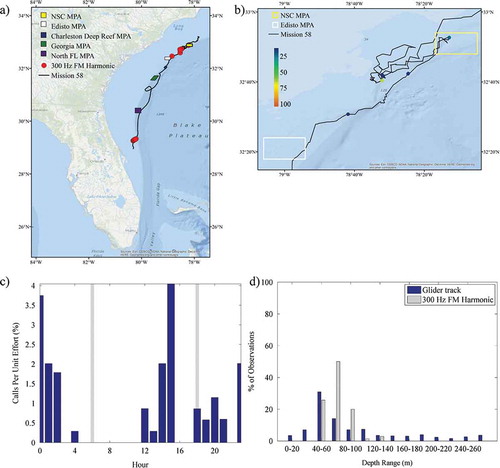
FIGURE 7. (a) Locations of acoustic files that contained 365-Hz harmonic sounds across the entire glider track (red circles; N = 373); (b) locations of those same files zoomed in to the northern portion of the track and binned as a percentage of 30-s files per hour; (c) percentage of 30-s files containing 365-Hz harmonic sound production normalized by the total number of files that were recorded during each hour (gray bars indicate local sunrise and sunset); and (d) percentage of 365-Hz harmonic observations and the overall glider track present within 20-m bottom depth intervals. Site abbreviations used in panels (a) and (b) are defined in .
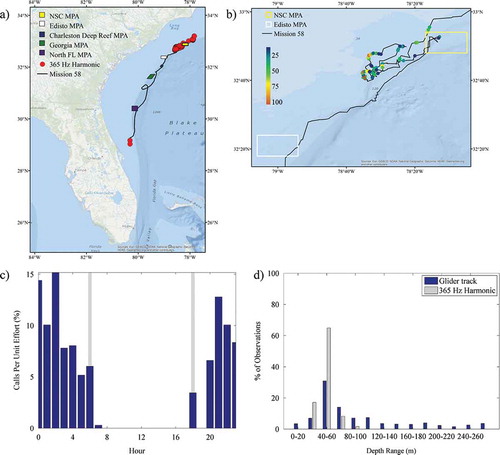
FIGURE 8. (a) Locations of acoustic files that contained marine mammal whistle sounds across the entire glider track (red circles; N = 60); (b) locations of those same files zoomed in to the northern portion of the track and binned as a percentage of 30-s files per hour; (c) percentage of 30-s files containing marine mammal whistles normalized by the total number of files that were recorded during each hour (gray bars indicate local sunrise and sunset); and (d) percentage of whistle observations and the overall glider track present within 20-m bottom depth intervals. Site abbreviations used in panels (a) and (b) are defined in .
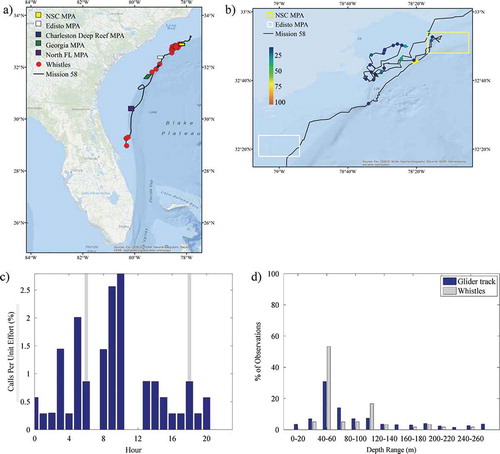
FIGURE 9. (a) Locations of acoustic files that contained marine mammal echolocation sounds across the entire glider track (red circles; N = 28); (b) locations of those same files zoomed in to the northern portion of the track and binned as a percentage of 30-s files per hour; (c) percentage of 30-s files containing marine mammal echolocation sounds normalized by the total number of files that were recorded during each hour (gray bars indicate local sunrise and sunset); and (d) percentage of echolocation observations and the overall glider track present within 20-m bottom depth intervals. Site abbreviations used in panels (a) and (b) are defined in .
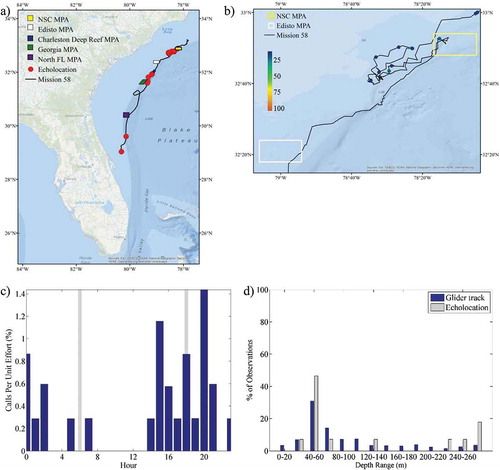
FIGURE 10. Glider-derived chlorophyll-a concentration (µg/L; log scale; upper panel) and dissolved oxygen concentration (mg/L; lower panel) off the southeastern U.S. coast over time. The plots are overlaid with observations of marine mammal whistles (black shaded circles) and echolocation sounds (open squares) displayed at the glider’s depth at the time the sounds were recorded.
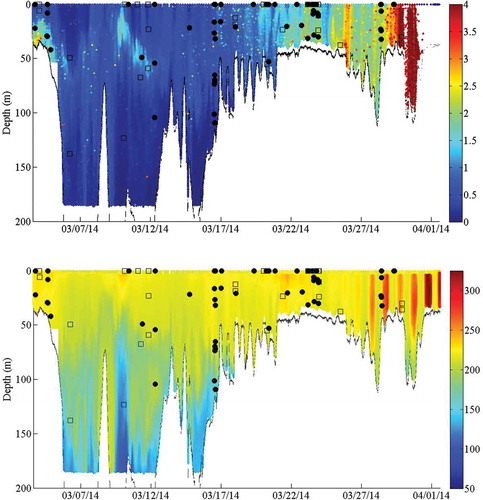
FIGURE 11. (a) Locations of acoustic files that contained boat noise across the entire glider track binned as a percentage of 30-s files per hour (N = 2,151); (b) the percentage of 30-s files containing boat noise normalized by the total number of files that were recorded during each hour (gray bars indicate local sunrise and sunset); and (c) percentage of boat noise and the overall glider track observations present within 20-m bottom depth intervals. Site abbreviations used in panel (a) are defined in .