
Figures & data
Figure 1. Simplified tectonic map of the Turkey earthquake region and surroundings (compiled from Tan Citation2021).
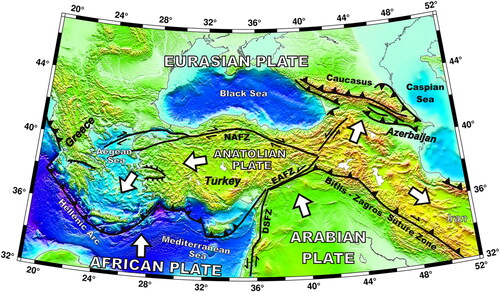
Figure 2. Record of severe earthquakes along the NAF in Turkey.
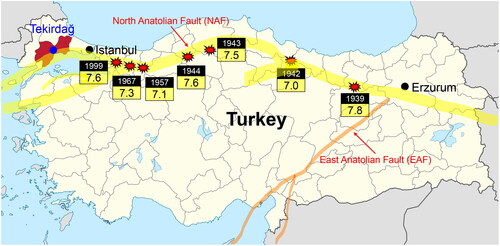
Figure 3. Satellite photo of the research area-Banarli landfill site.
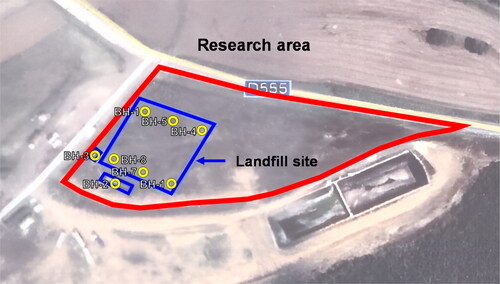
Figure 4. Historical earthquakes (between 1912 and today) in the Marmara Sea region (compiled from Aksoy et al. Citation2010).
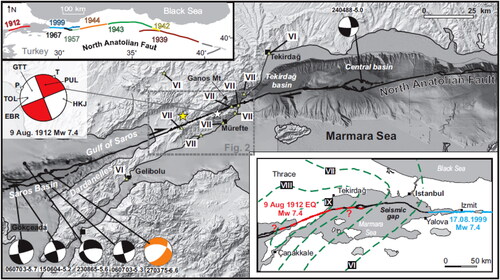
Figure 5. (a) Structural damages (compiled from Sadi Citation1912) and (b) surface ruptures (compiled from Ambraseys and Finkel Citation1987) in the murefte earthquake.
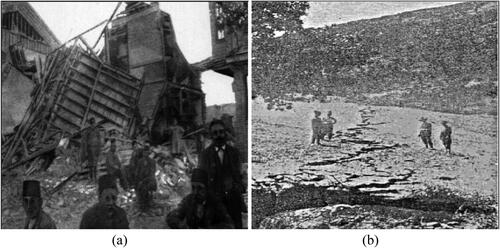
Figure 6. Flowchart for the assessment of liquefaction potential (modified from Nath et al. Citation2018).
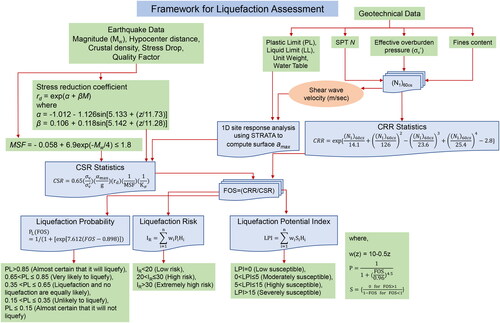
Table 1. Classification of liquefaction potential based on liquefaction probability (Juang et al. Citation2013).
Table 2. Summary of acceleration and earthquake records of Kocaeli and Kobe earthquakes.
Figure 7. Acceleration of (a) the Kocaeli and (b) Kobe earthquakes at base rock and surface.
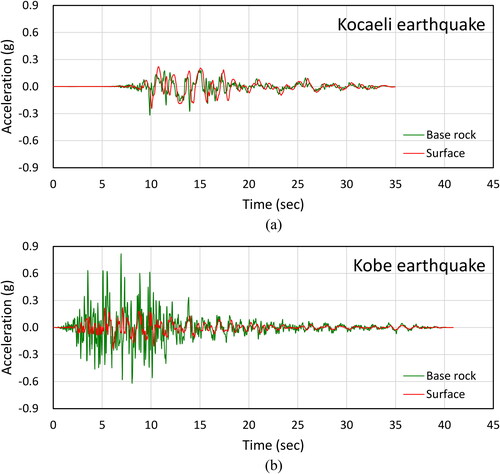
Figure 8. Spectral acceleration of (a) the Kocaeli and (b) Kobe earthquakes at base rock and surface.
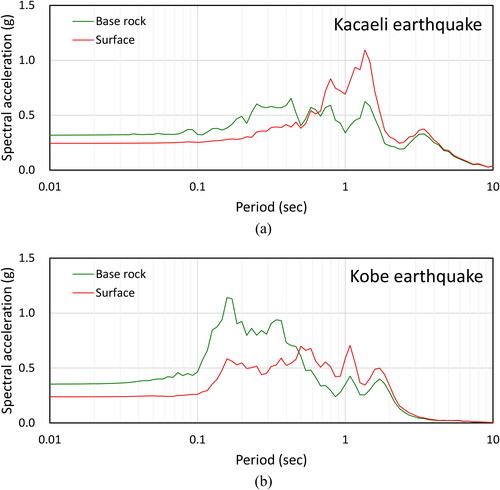
Figure 9. Amplification factor of the Kocaeli and Kobe earthquakes.
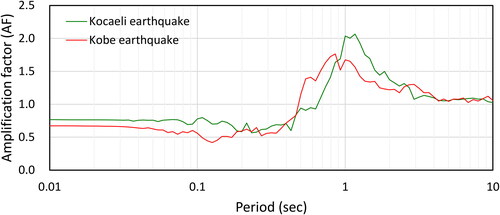
Figure 10. Arias intensity of the Kocaeli and Kobe earthquakes.
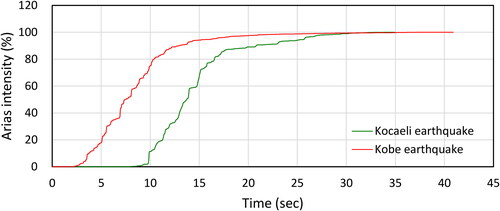
Figure 11. Results of SPT test, shear wave velocity (Vs), and maximum shear modulus (G0) in consequence of soil profile.
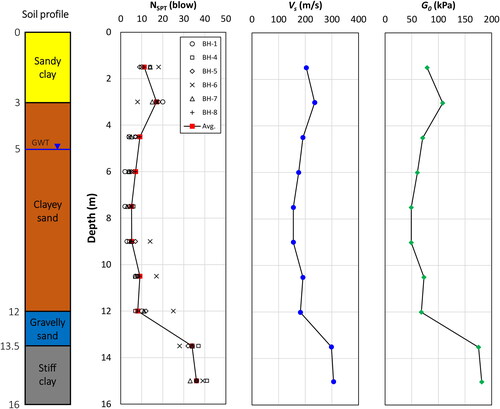
Figure 12. Results of (a) the probability of liquefaction (PL), (b) liquefaction potential index (LPI), and (c) liquefaction risk index (IR) in the Banarli area.
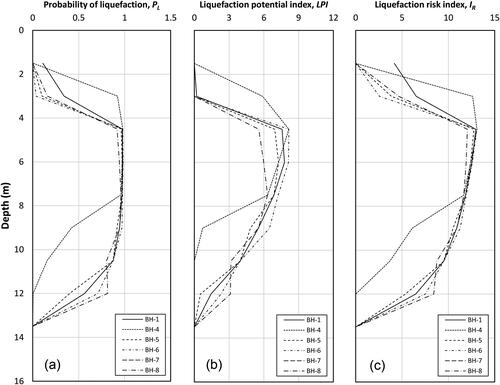
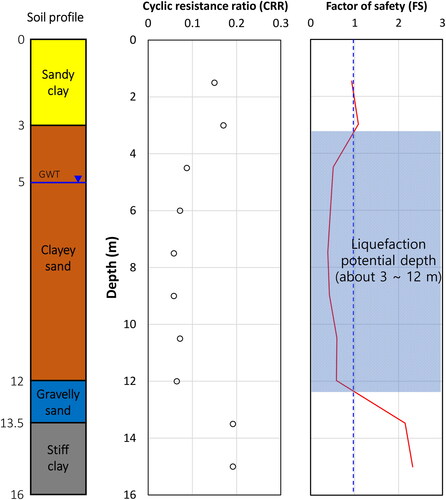
Figure 13. Cyclic resistance ratio results and factor of safety found by using liquefaction analysis by soil profile.
Data availability statement
The research data of this study can be obtained by requesting the corresponding author.