
Figures & data
Figure 1. Map showing (a) Africa, (b) Nigeria, (c) Niger Delta, (e) identified coastal cells.
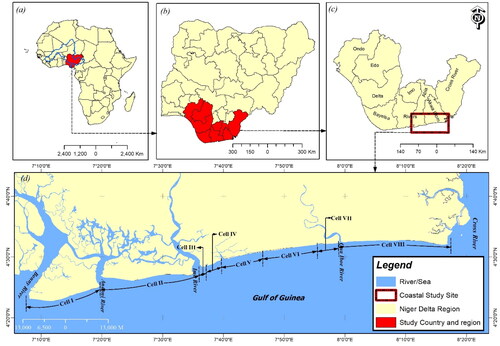
Figure 2. Picture of geomorphologic features (a–b) cells I, (c–d) cell VIII.
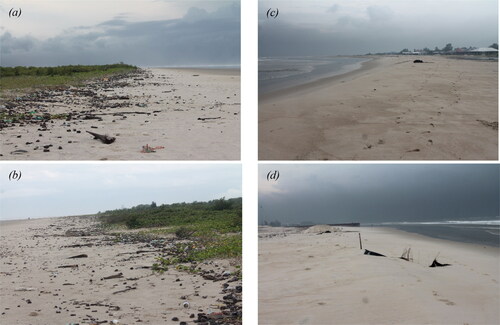
Table 1. Summary of analyzed Sentinel-1 GRD data.
Figure 3. Methodological framework flow chart for shoreline change.
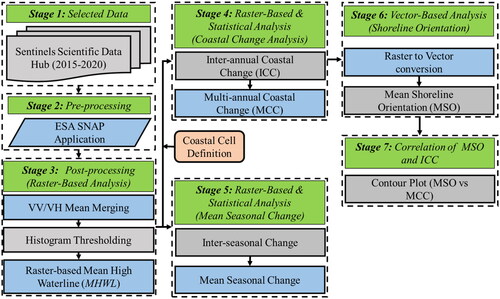
Figure 4. Alongshore spatial distribution of total accretion, total erosion and net change for 201–2020in each of the eight coastal cells between Bonny River and Cross River (a) Cell I; (b) Cell II; (c) Cell III; (d) Cell IV; (e) Cell V; (f) Cell VI; (g) Cell VII; (h) Cell VII.
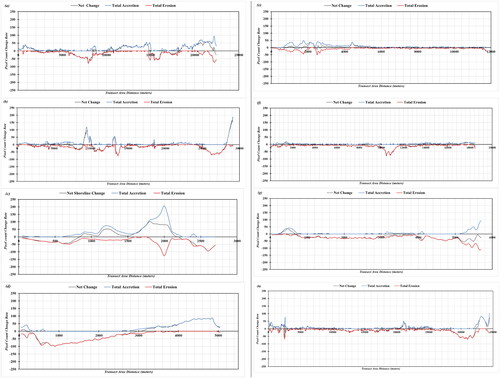
Table 2. Length of coastal stretch and the overall multi-annual coastal change for each coastal cell.
Figure 5. Shoreline position changes disaggregated into wet and dry season contributions. Left hand panels show the seasonal contributions in each year, right hand panels show net wet and dry season contributions for 2015–2020. (a) Cell I; (b) Cell II; (c) Cell III; (d) Cell IV; (e) Cell V; (f) Cell VI; (g) Cell VII); (h) Cell VIII.
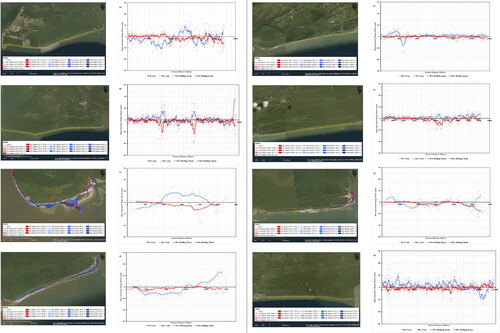
Figure 6. Plots of local mean shoreline orientation against net shoreline change in the period 2015–2020. (a) Cell I; (b) Cell II; (c) Cell III; (d) Cell IV; (e) Cell V; (f) Cell VI; (g) Cell VII); (h) Cell VIII.
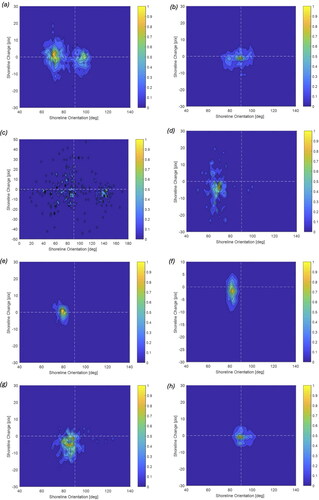
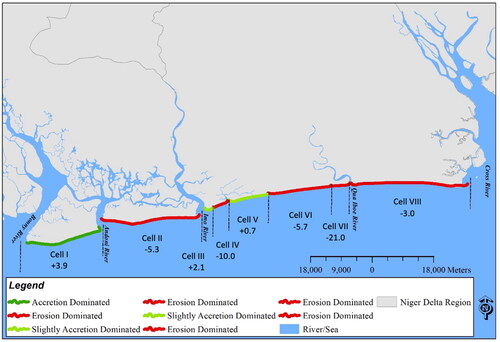
Figure 7. Summary of the net changes observed in cells I–VIII over the period 2015–2020. The figures shown for each cell represent the difference between the mean accretion and erosion values in (positive indicates net accretion, negative indicates net erosion; units are 10 × 10 m pixels).
Data availability statement
The data utilized in this research can be utilized to publish additional paper; therefore, they can be available upon request.