Figures & data
Figure 1. Vivomixx-treatment improves the motor disability of TMEV-mice. (a) Scheme of the experimental groups. Mice were administered 3 × 10⁸ cfu Vivomixx by oral gavage three times a week from day 70 pi to 85 dpi. Control mice were administered autoclaved water alone. b) Horizontal (HACTV) and vertical activity (VACTV), as well as motor coordination were evaluated. The data are presented as the means ± SEM: ***p < .001 vs. S; ##p < .01 vs T; n = 10 mice/group studied in two independent experiments.
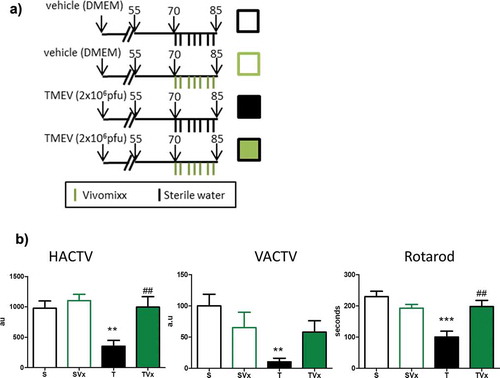
Figure 2. Changes in gut microbiota population after Vivomixx treatment. Fecal pellets were collected freshly from each mouse before and after probiotic treatment. A) Stacked bar charts of the relative abundance of main bacterial communities, at genus level, present in the different experimental groups. Extended error bar plots, at phylum (b) and genus level (c), shows the differences in the mean proportions of bacterial taxa in TMEV mice before (black) and after treatment (green). Corrected p-values are shown on the right. D) Quantification of the plasma levels of acetate and butyrate. The data are presented as the means ± SEM: ***p < .001 vs. S; ##p < .01 vs T; n = 5 mice/group.
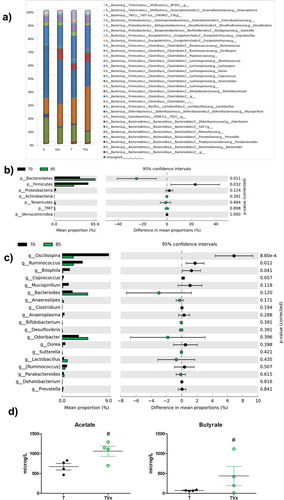
Figure 3. Effect of Vivomixx treatment on the T and B cell populations in the CNS. A single cell leukocyte suspension was obtained from the brain and spinal cord. A, H) Representative flow cytometry plots of CD45+CD3+CD4+ T cells, CD45+CD3+CD8+ T cells (a), and B220+CD19+ B cells and CD5+CD1dhigh cells gated on B220+CD19+ B cells (h). B-D) Quantification of the change in the number of CD45+CD3+CD4+, CD45+CD3+CD8+ T cells and leukocytes relative to S mice E) Representative flow cytometry plots of CD39Foxp3 cells gated on CD45+CD3+CD4+ T cells. F-G) Percentage of Foxp3+CD39+ and Foxp3−CD39+ T cells gated on CD45+CD3+CD4+ T cells, respectively. The data represent the change relative to the S mice. I) Quantification of the change in the percentage of B220+CD19+ B cells relative to the S mice. J) Percentage of CD5+CD1dhigh cells gated on B220+CD19+ B cells in the CNS: Groups S, T (n = 10); groups SVx, TVx (n = 5); **p < .01 vs S; ***p < .001 vs. S; #p < .05 vs. T; ###p < .001 vs T.
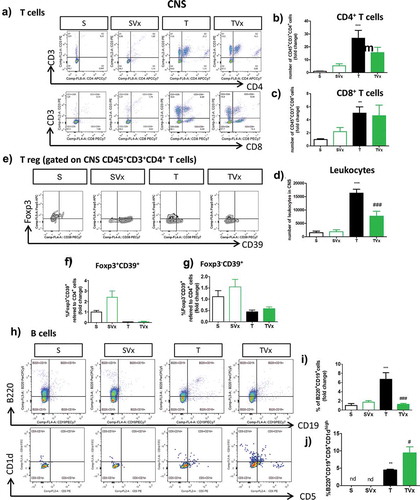
Figure 4. Vivomixx administration in the chronic phase of TMEV-IDD promotes anti-inflammatory responses in the spinal cord. A) Representative images of transversal spinal cord sections immunostained with Iba-1 to label microglia. Scale bar 100 μm. Below are higher magnification images (63x) of Iba-1 stained cells that indicate the changes in morphology. Scale bar 10 μm. Quantification of the area occupied by Iba-1 staining is also shown on the right. B) Representative images of GFAP (red) and Vimentin (green) staining in the spinal cord together the quantification of Vimentin-GFAP overlap through the Manders coefficient measure. C) qRT-PCR analysis of inflammatory markers (mIL-1β, mIL-6, mTNF-α, mIL-4 or mIL-10) in the spinal cord as assessed using the 2−ΔΔCt method. *p < .05 vs. S; **p < .01 vs. S; ***p < .001 vs. S; #p < .05 vs. T; ##p < .01 vs. T.
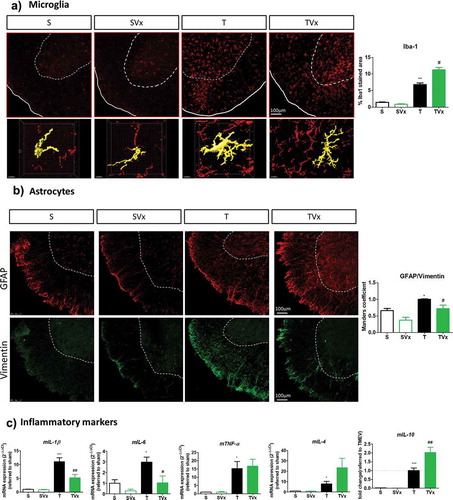
Figure 5. Subtle changes in the peripheral immunological response after Vivomixx administration to TMEV-mice. A spleen cell suspension was stained to analyze the CD4, CD8, CD39+ Treg and Breg cell populations. a) Representative flow cytometry plots of CD45+CD3+CD4+ T cells and CD45+CD3+CD8+ T cells, along with their corresponding quantification. b) Histogram of fluorescence emitted by CD3+CD4+ spleen cells from representative mice in each experimental group. c) Flow cytometry plots of Foxp3+CD39+ Treg cells gated on CD45+CD3+CD4+ T cells, together with a quantification of the percentage of Foxp3+ T cells (gated on CD4+ T cells), Foxp3−CD39+ and Foxp3+CD39+ Treg cells. d) Representative flow cytometry images and quantification of the B220+CD19+ cells in the spleen, together with a normalized histogram and quantification of CD1d expression in B220+CD19+CD5+ gated cells. Groups. S, T (n = 10); groups SVx, TVx (n = 5); **p < .01 vs S; ***p < .001 vs. S; #p < .05 vs. T; ###p < .001 vs T.
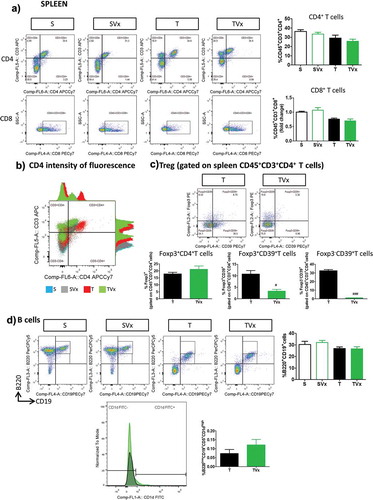
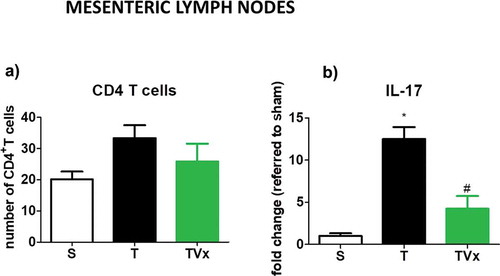
Figure 6. Vivomixx affects the Th17 responses in the MLNs. CD4 T cells isolated from MLN were polarized to Th17 in culture. The expression of IL-17 was measured by ELISA, and the data represent the mean ± SEM of the change relative to the S or T mice from two experiments performed in triplicate: *p < .001 vs S; #p < .05 vs T.