
Figures & data
Table 1. Baseline characteristics of study participants
Figure 1. Flow chart of the Gut2Brain study
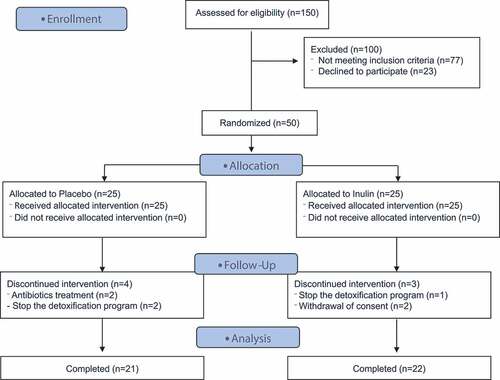
Figure 2. Changes in gastrointestinal symptoms after inulin supplementation in AUD patients. Values are mean ± SEM. Gastrointestinal symptoms including abdominal pain (a), bloating (b) and satisfaction of intestinal transit (c), impact of the symptoms on daily life (d), stool frequency (e), Bristol stool form scale (f) and (g) total tolerance score. Linear mixed models were performed for detecting the treatment effect throughout the study. D1 represents the baseline score before the supplementation. D3 represents the first day of inulin or placebo treatment
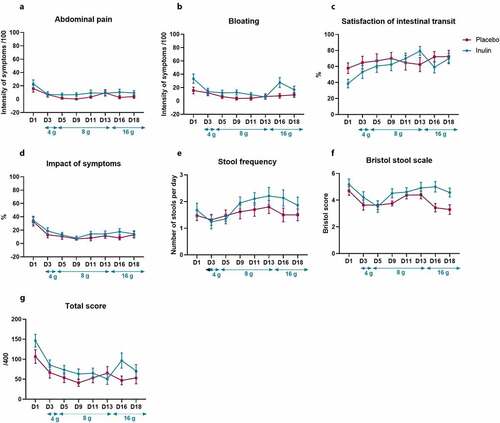
Figure 3. Effect of inulin supplementation on gut microbiota composition in alcohol use disorder patients. (a) Principal coordinate analysis (PCoA) of the Bray Curtis index (b) Changes in alpha-diversity indexes: Number of observed species, Chao-1 and Shannon. *p < .05, **p < .01,***p < .001 (c) Changes in total bacteria measured by qPCR. (d) Relative abundances of bacterial taxa accounting for more than 1%, at the phylum and family levels, assessed using Illumina 16S rRNA gene sequencing in AUD patients supplemented with placebo (n = 19) or inulin (n = 19). Wilcoxon paired tests were performed to compare the evolution from baseline in each group. P-values were adjusted to control for the false discovery rate for multiple testing according to the Benjamini and Hochberg procedure *q < 0.10 in inulin group, † q < 0.10 in placebo group. (e) Relative abundances of genera that were significantly change between T1 and T2 in inulin group. Wilcoxon paired tests were performed and p-values were adjusted to control for the false discovery rate for multiple testing according to the Benjamini and Hochberg procedure *q < 0.1 (f) Spearman correlation between the change in sociability score (T2-T1) and the change of Bifidobacterium levels (T2-T1) measured by qPCR in inulin group
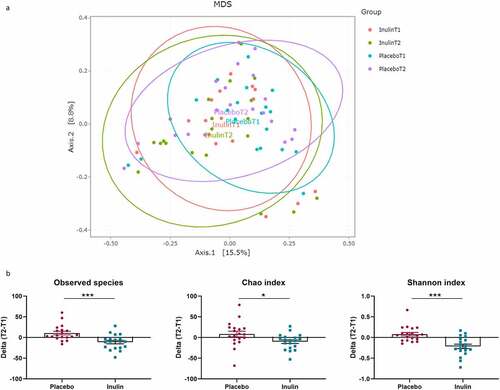
Figure 3. Continued
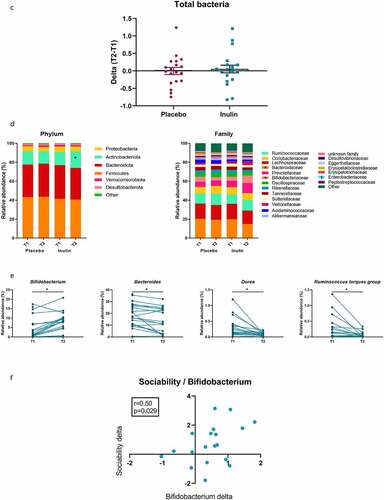
Table 2. Significant changes in relative abundance of gut bacteria at the genus level in AUD patient receiving inulin or placebo for 3 weeks*
Table 3. Effect of inulin supplementation on biological parameters
Table 4. Effect of inulin supplementation on psychological parameters
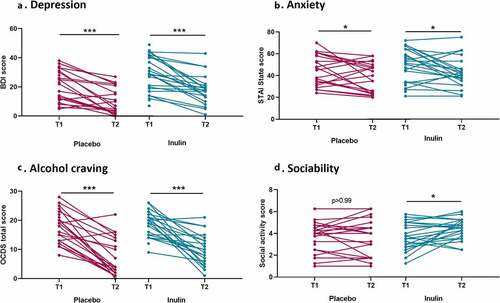
Figure 4. Effect of inulin supplementation on psychological parameters in Alcohol use disorder patients. (a) Score of depression measured by the Beck Depression Inventory. (b) Anxiety measured by the State-Trait Anxiety Inventory (form YA). (c) Alcohol craving (total score) measured by the Obsessive-Compulsive Drinking Scale. (d) Sociability score (social medium pleasant activity score) measure by the social activity test. Wilcoxon signed ranks tests or paired T-tests were performed to analyze changes from baseline according to the distribution *p < .05, **p < .01,***p < .001
Supplemental Material
Download Zip (169.3 KB)Data availability statement
The datasets used and/or analysed during the current study are available from the corresponding author on reasonable request. The accession number for the raw data generated with the 16S rRNA gene sequencing reported in this paper is BioProject PRJNA745947 (SRA) and are available here https://www.ncbi.nlm.nih.gov/bioproject/PRJNA745947/.