6,471
Views
12
CrossRef citations to date
0
Altmetric
Research Paper

Postnatal exposure to ambient air pollutants is associated with the composition of the infant gut microbiota at 6-months of age

, , , , , , , , , , , , & show all
Article: 2105096 | Received 24 Feb 2022, Accepted 13 Jul 2022, Published online: 13 Aug 2022

Figures & data

Table 1. Characteristics of mother-infant pairs from the Mother’s Milk Study.

Figure 1. Dendrograms show the associations between NO2, PM10, and PM2.5 exposure with infant gut microbial taxa at 6 months of age using zero-inflated negative binomial regression (ZINBR) analyses. Associations are displayed on a branching tree that shows the phylogenetic relationship between taxa examined in this analysis where branch lengths do not represent evolutionary time. ZINBR models adjusted for infant sex, breastfeeding per day, socioeconomic status, birthweight, and infant age. The direction and magnitude of the association was determined from the incidence risk ratio’s (IRR) distance from an effect estimate which would indicate zero association (IRR = 1). IRRs greater than one represent positive associations (blue), IRRs less than one represent negative associations (red), and the node size denotes the strength of the association. Only associations that were statistically significant at a 10% false discovery rate (PFDR < 0.10) are shown. Nodes framed by a dashed circle indicate statistical significance at a 5% false discovery rate (PFDR <0.05). Each edge in the dendrogram represents various phylogenetic levels (inner to outer circle: kingdom, phylum, class, order, family, genus).

Figure 1. Dendrograms show the associations between NO2, PM10, and PM2.5 exposure with infant gut microbial taxa at 6 months of age using zero-inflated negative binomial regression (ZINBR) analyses. Associations are displayed on a branching tree that shows the phylogenetic relationship between taxa examined in this analysis where branch lengths do not represent evolutionary time. ZINBR models adjusted for infant sex, breastfeeding per day, socioeconomic status, birthweight, and infant age. The direction and magnitude of the association was determined from the incidence risk ratio’s (IRR) distance from an effect estimate which would indicate zero association (IRR = 1). IRRs greater than one represent positive associations (blue), IRRs less than one represent negative associations (red), and the node size denotes the strength of the association. Only associations that were statistically significant at a 10% false discovery rate (PFDR < 0.10) are shown. Nodes framed by a dashed circle indicate statistical significance at a 5% false discovery rate (PFDR <0.05). Each edge in the dendrogram represents various phylogenetic levels (inner to outer circle: kingdom, phylum, class, order, family, genus).

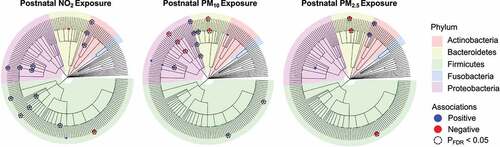
Table 2. Infant gut bacterial genera belonging to dominant phyla were associated with postnatal exposure to ambient air pollution (AAP).

Figure 2. Associations between (a) NO2, (b) PM10, and (c) PM2.5 exposure during the first 6 months of life and differentially ranked log ratios. The differentially ranked log ratios represent the ratio between the top and bottom 35% of sOTUs as ranked based on their association with each pollutant by Songbird (i.e., important taxa).

Figure 2. Associations between (a) NO2, (b) PM10, and (c) PM2.5 exposure during the first 6 months of life and differentially ranked log ratios. The differentially ranked log ratios represent the ratio between the top and bottom 35% of sOTUs as ranked based on their association with each pollutant by Songbird (i.e., important taxa).
Supplemental material

Supplemental Material

Download Zip (5.9 MB)