Figures & data
Figure 1. In vitro fermentation of processed whole grains identified high and low carbohydrate utilizing microbiomes from donors. (a) Carbohydrates utilized; (b-d) short-chain fatty acid production; (e) differentially abundant ASVs. ASVs were named by genus (or lowest taxonomic rank available) followed by the first four characters of the feature ID generated from QIIME 2; wwp, whole wheat porridge; wwe, whole wheat extrudate; **p < .01; data from.Citation9
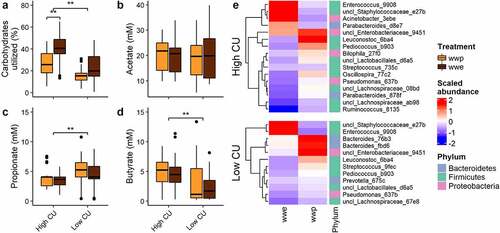
Figure 2. Extruded diets worsened host metabolic health compared with non-extruded diets in mice harboring a high CU microbiome. Study design (a); body weight (b), body fat (c), lean mass (d), body weight gain (e), change in body fat (f), change in lean mass (g), fasting blood glucose (h), fasting insulinemia (i), glycemia during intraperitoneal glucose tolerance test (j), area under the glycemia curve (k); index of insulin resistance (l), complete linkage clustering based on Euclidean distance of treatment means of data in panels B-L (m); lf, low fat control; wd, Western diet; wd_wwp, wd + whole wheat porridge; wd_wwe, wd + whole wheat extrudate; wd_bre, wd + brown rice extrudate; treatments marked with different letters within panel are significantly different from one another (Tukey’s HSD p < .05).
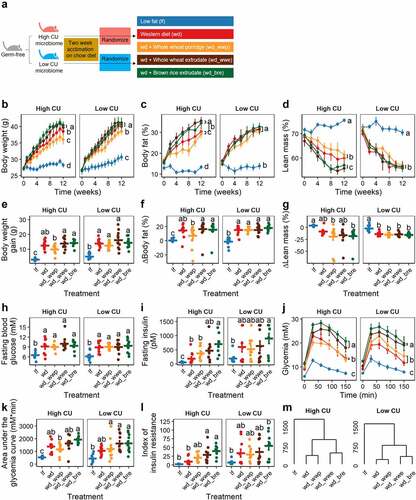
Figure 3. Mice inoculated with the high CU microbiome showed greater variance in microbiota composition among treatments during feeding compared with the low CU microbiome mice. Principal coordinate analysis biplots of unweighted (A) and weighted (B) UniFrac distance matrices; distance from donor microbiome and group dispersions (variances) based on unweighted (C, E) and weighted (D, F) UniFrac distances, respectively; ****p<0.001 (t-test).
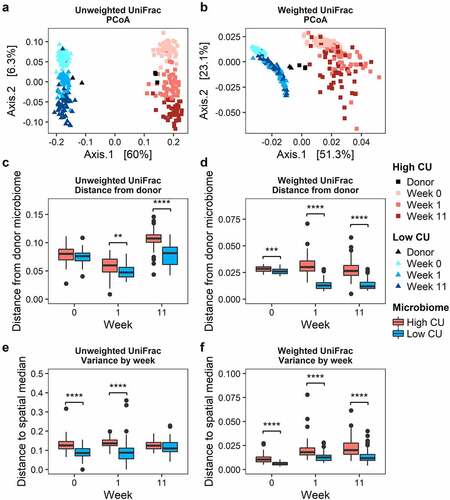
Figure 4. Changes in microbiome composition during feeding clustered by processing method in mice harboring the high CU microbiome. ASVs with significant log2 fold changes (DESeq2 padj<0.05) during feeding of high (a) and low (b) CU microbiomes; ASVs are clustered by phylogeny; treatments are clustered by the complete-linkage method based on Euclidean distance; ASVs with the largest absolute value of the log2 fold change (top 20%) are labeled; lf, low fat control; wd, Western diet; wd_wwp, wd + whole wheat porridge; wd_wwe, wd + whole wheat extrudate; wd_bre, wd + brown rice extrudate.
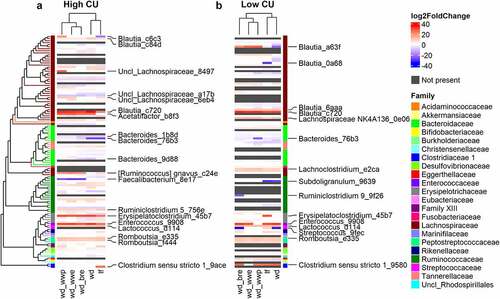
Figure 5. Extruded diets resulted in differential ASVs with strong correlations to negative host outcomes in the high CU microbiome mice. Differential ASVs associated with extruded (wd_extr) and non-extruded (wd_wwp) diets in high CU (a) and low CU (b) microbiomes; correlations between differential ASVs in high CU (c) and low CU (d) microbiomes and host metabolic variables; wd_extr, Western diet + whole wheat extrudate (wd_wwe) and brown rice extrudate (wd_bre); non-extruded diet included the Western diet + whole wheat porridge (wd_wwp); ASVs were named by genus (or lowest taxonomic rank available) followed by the first 4 characters of the feature ID generated from QIIME2; *p < .05, **p < .01, ***p < .001, ****p < .0001 (Spearman correlation with Benjamini-Hochberg p-value adjustment).
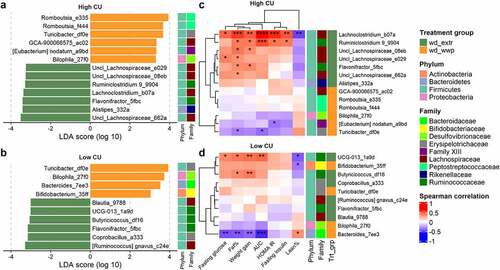
Figure 6. ASVs associated with extrusion were predicted to contribute to elevated sugar degradation and SCFA production in the high CU microbiome mice. Predicted (PICRUSt2) metabolic pathway classes with significant differences between extruded and non-extruded diets (a); SCFA pools in the cecum and colon measured at necropsy (b); wd_extr, extruded diets (wd_wwe and wd_bre); *p < .05, **p < .01, ***p < .001, ****p < .0001 (Wilcoxon-test with Benjamini-Hochberg p-value adjustment).
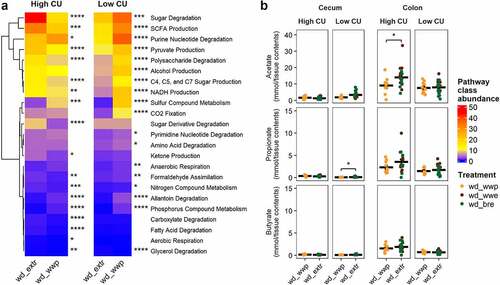
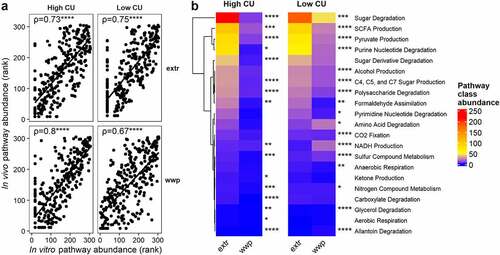
Figure 7. ASVs associated with extrusion were different during an in vivo study compared with prior in vitro study but showed similar predicted functionality. Spearman’s rank correlation plots between predicted pathway abundances contributed by differentially abundant ASVs in vivo versus in vitro in high and low carbohydrate utilization microbiomes on extruded (extr) or non-extruded (wwp) substrates (a); mean abundances of pathway classes with significant differences between extr and wwp (b); *p < .05; **p < .01; ***p < .001; ****p < .0001 (Wilcoxon-test with Benjamini-Hochberg p-value adjustment).