Figures & data
Figure 1. Rhubarb and inulin improve body weight gain and adiposity in response to high-fat and high-sucrose diet (a) Body weight (g) over a 7 weeks period and final body weight. (b) Cumulative fat mass gain (g) from day 0 to day 42. (c) Body composition (fat mass and lean mass) as a percentage of total body weight at the end of the experiment. (d) Mean food intake (kcal) over the 7 weeks period. (e) Plasmatic insulin levels after 6 h of fasting (µg/L). (f) Liver weight (g), total hepatic lipid content (µg lipids/mg liver) and hepatic triglycerides (nmol/mg liver). (g) Total plasma cholesterol (mM). (h) Adipose tissue weights (mg) measured after 7 weeks of experiment. EAT, epididymal adipose tissue, SAT, subcutaneous adipose tissue, VAT, visceral adipose tissue. Black, CTRL fed mice; Red, HFHS fed mice; Green, Rhubarb-supplemented mice (RHUB); Blue, Inulin-supplemented mice (ITF); Yellow, mice supplemented with both rhubarb and inulin (RHUB+ITF). Data represent mean ± S.E.M. For panel A, B and C, * represents a significant difference between CTRL and HFHS groups; # represents a significant difference between HFHS and RHUB groups; $ represents a significant difference between ITF and RHUB+ITF; & represents a significant difference between RHUB and RHUB+ITF groups. For all other panel, * represents significant difference between indicated groups. *,#,$,& p ≤ .05, **,##,$$,&& p ≤ .01, ***,###,$$$,&&& p ≤ .001. n = 15/group.

Figure 2. Rhubarb and inulin together increase energy expenditure and substrate oxidation (a) Left panel, daily oxygen consumption (VO2, mL/h/kg) normalized to body weight during the light phase (from ZT0 to ZT12) and dark phase (from ZT12 to ZT24) determined by indirect calorimetry analysis. Clear and shaded zones indicate light phase and dark phase, respectively. Time is expressed in Zeitgeber time and considers ZT0 as the time when light turns on and ZT12 when light turns off. Right panel, oxygen consumption normalized to body weight per phase (light, dark and whole day) per mouse (mL/h/kg). (b) Daily carbon dioxide released (VCO2, mL/h/kg) normalized to body weight. Carbon dioxide released normalized to body weight per phase. (c) Daily energy expenditure as percentage of body weight (kcal/h/kg). Energy expenditure per phase and per mouse. (d) Daily respiratory exchange ratio (RER). Data represent mean ± S.E.M. * represents a significant difference between CTRL and HFHS groups; # represents a significant difference between HFHS and RHUB groups; @ represents a significant difference between HFHS and ITF groups; $ represents a significant difference between ITF and RHUB+ITF; & represents a significant difference between RHUB and RHUB+ITF groups. § represents a difference between HFHS and RHUB+ITF groups. *,#,$,&,@,§ p ≤ .05, **,##,$$,&&,@@,§§ p ≤ .01, ***,###,$$$,&&&,@@@,§§§ p ≤ .001. n = 12–13/group.
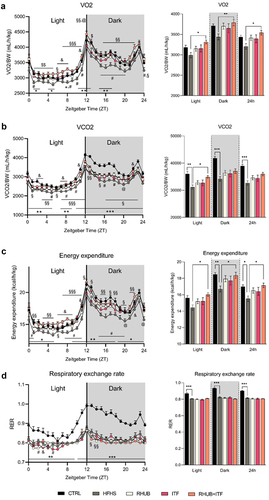
Figure 3. Inulin and rhubarb increase BAT activity and lipolysis (a) Brown adipose tissue weight (g). (b) Brown adipose tissue citrate synthase activity (µmol/mg BAT/sec). (c) Rectal body temperature (°C). (d) mRNA relative expression of Ucp1, Prdm16 and Elovl3 in BAT. (e) mRNA relative expression of Acsl1, Hsl, Cd36, Atgl, Pgc1a, Pgc1b in subcutaneous adipose tissue. (f) Representative pictures of brown adipose tissue Hematoxylin and Eosin staining. Scale bar, 25 µM (magnification is 20x). Adipocyte size (µm2) measured in 5 different sections of brown adipose tissue per mouse. (g) Representative images of staining for UCP1 in BAT. Scale bar, 25 µm (magnification is 20x). Data represent mean ± S.E.M. * represents significant difference between indicated groups. * p ≤ .05, ** p ≤ .01, *** p ≤ .001. n = 15/group.
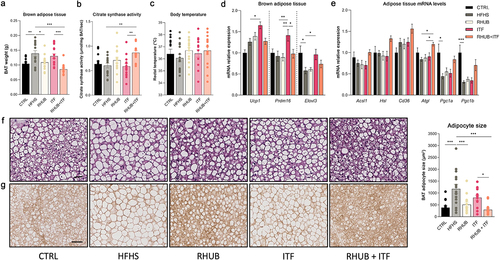
Figure 4. Combination of inulin and rhubarb improve gut barrier function (a) Representative pictures of colon Alcian blue staining showing inner mucus layer (IML) and goblet cells (GC). Scale bar, 25 µm (magnification is 20x). (b) Mucus thickness measured over the entire colon diameter on at least three different sections per mice. Mucus in goblet cells measured as % of blue in the epithelium in at least 3 different sections per mice. (c) mRNA relative expression of Reg3g, Intectin and Pla2g2 in the colon. (d) Cecum weight (g). (e) Active GLP1 concentration (pg/mL) in vena porta. (f) Bile acid concentration of conjugated and unconjugated bile acids (pmol/µL) in vena porta. (g) Short-chain fatty acid concentration in cecal content (nmol/mg dry cecal content). Data represent mean ± S.E.M. * represents significant difference between indicated groups. * p ≤ .05, ** p ≤ .01, *** p ≤ .001. n = 15/group.
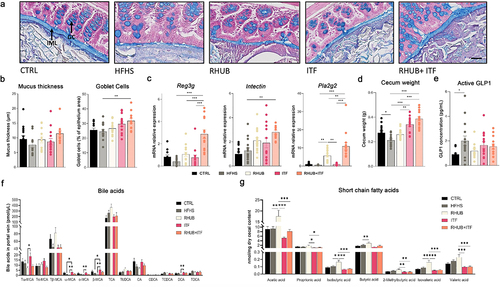
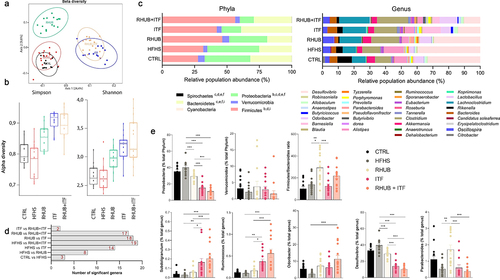
Figure 5. Inulin alone or in combination with rhubarb leads to a shift in the composition of gut microbiota (a) Non-metric multidimensional scaling (MDS) representing the Jaccard-binary differences between individuals within groups. (b) Simpson and Shannon alpha-diversity from cecal content. (c) Relative abundance obtained by OTUs of the major bacterial phyla (left) and genera (right). (d) Number of significant genera differentially modulated across the conditions, based on Kruskal-Wallis comparison test. (e) Relative abundance of specific bacterial phyla and genera in each sample among the groups. (c,d, e) Kruskal-Wallis with Dunn’s multiple comparison test. Data represent mean ± S.E.M. * represents significant difference between indicated groups. * p ≤ .05, ** p ≤ .01, *** p ≤ .001. n = 15/group.