
Figures & data
Table 1. Demographic and clinical features of study participants. IQ were only available for around half the cases, and only one of the non-affected children (ADHD sibling with an IQ of 116). Three cases (one each of ADHD, ASD, and comorbid ADHD+ASD) furthermore had the diagnosis mental retardation (F70F71), while one ADHD case were diagnosed with borderline intellectual functioning (R41.8). Feces consistency described the fecal sample that was investigated and was rated by the parents according to the Bristol stool chart. All participants using Polyethylene Glycol 3350 (MovicolTM) were diagnosed with chronic constipation. No other medications targeting gastrointestinal symptoms were utilized by the study participants. Study participants were in some cases, evaluated with more than one diagnostic instrument. For a few study participants, the diagnostic instrument used for diagnosis, or the specific type of ADHD medication were not specified. ADOS2: the Autism Diagnostic Observation Schedule 2nd edition. ADHD-RS: ADHD rating scale. T.O.V.A: Test of Variables of Attention. KSADS-COMP: Kiddie Schedule for Affective Disorders and Schizophrenia, Computer version. Only the specified ADHD medications were utilized amongst children included in this manuscript, which corresponds to the most commonly used ADHD medications prescribed to children and adolescents in Denmark. Statistical significance is presented as □ = p < 0.05 compared to ADHD cases, ○ = p < 0.05 compared to ASD cases, ▲= p < 0.05 compared to comorbid ADHD/ASD.
Figure 1. Alpha-diversity of each diagnostic group. The alpha diversity is determined using a) ASV richness, b) Shannon diversity index, and c) Faith’s Phylogenic Diversity. P-values are based on linear mixed effect models, with sibling pairs as random effects and pairwise testing adjusted for multiple comparisons using Tukey’s method. Cases were compared to non-affected siblings and non-related children, while non-affected siblings were compared to non-related children.
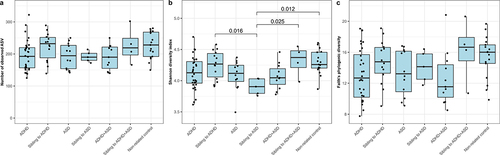
Figure 2. Beta-diversity of each diagnostic group. The beta-diversity is presented using principal coordinate analysis (PCoA), with either Bray-Curtis dissimilarities (a-c), weighted UniFrac (d-f), or unweighted UniFrac (g-i). The individual groups were analyzed as either ADHD (a, d, and g) or ASD (b, e, and h) compared to the non-related children, or as ADHD, ASD, and comorbid ADHD/ASD compared to each other (c, f, and i). Ellipses depict 95% confidence intervals. PERMANOVA results are indicated with adjusted p-values and R2 and represent the overall differences in beta-diversity. For cases compared to siblings and non-related children combined, see supplementary figure S2. Pairwise PERMANOVA comparisons can be seen in Supplementary data S1, while confounders as fixed effects are found in supplementary data S2.
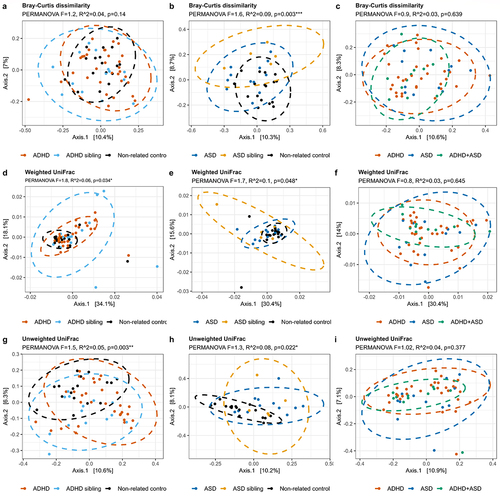
Figure 3. Composition of bacteria in each diagnostic group. Relative abundance of the individual bacterial at the taxonomic levels phylum (a) and genus (b), depicted as percentage of total bacteria per sample. For phylum, data are represented as a barplot, with a grouping of phyla that comprise<1% of total relative abundance. For ease of interpretation, genera are represented using a heatmap, with the 20 most abundant genera listed.
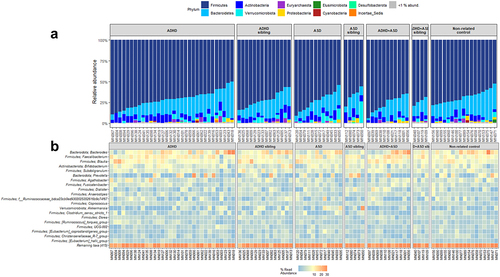
Figure 4. Differential abundant bacterial genera based on the ANCOM-BC analysis. Genera that differentiate significantly between the groups are displayed when adjusting for sibling effects, with effect size (log fold change) and 95% confidence error bars. All effect sizes with Benjamini-Hochberg corrected p-values<0.05 are displayed. A) Pairwise differential abundance analysis of children with ADHD compared to non-related controls. B) Pairwise differential abundance analysis of children with ASD compared to non-related controls. No significant bacterial differences were observed when comparing children with ADHD or ASD to each other supplementary data S3.
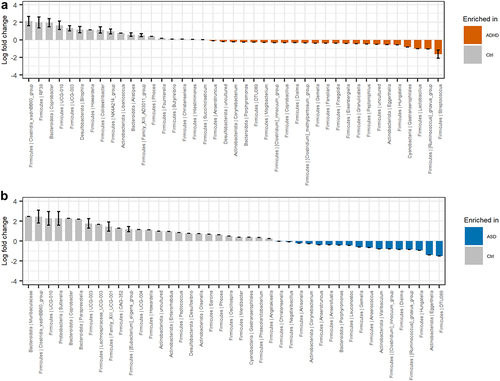
Figure 5. Immunoproteomic measurements of systemic involvement in ADHD and ASD. a) ELISA-based measures of blood plasma LBP in triplicate. A single outlier was observed and removed from statistical tests (non-related control MN154 duplicate 1). We defined outliers as measures outside of Quartiles 1 and 3 ± 1.5× interquartile range (IQR), where outliers were removed if only one of the replicates was defined as an outlier with more than the IQR between the two measures. b ELISA-based measure of fecal calprotectin performed as singletons. Notably, the child with the highest fecal calprotectin concentration was subsequently diagnosed with Crohn’s disease. Excluding this child from the statistics did not affect the results. c-f) Duplicate measures of Meso Scale-based measures of immune markers. Meso Scale results are displayed as median normalized and log2 transformed signal intensities, with averaged technical replicas. The red line indicates the measured log2 signal of blank controls, consisting of buffer. Only measures with noteworthy variations between cases and controls are analyzed here, with additional figures found in supplementary figures S4–7. Cases were compared to other cases, the matching sibling group or to non-related children, with sibling pair as random effect.
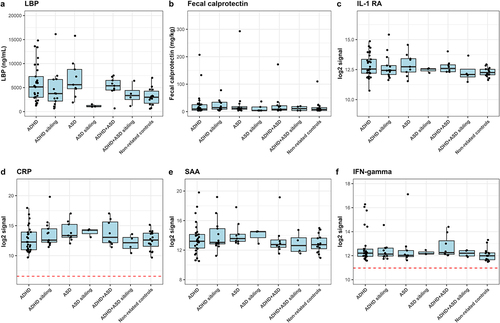
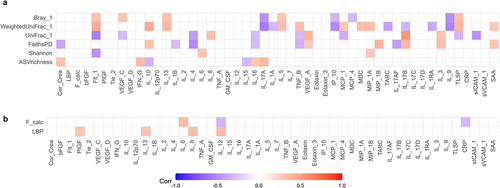
Figure 6. Multilevel correlation-testing of gut microbiota and intestinal permeability compared to systemic inflammatory markers. Multilevel Spearman’s correlation analysis of the correlation between a) bacterial alpha-and beta-diversity and b) fecal calprotectin and LBP compared to immunoproteomic markers, with sibling pair as random effect. Only correlations with Benjamini-Hochberg adjusted p-values<0.05 are displayed. Blue values indicate a negative correlation (rho−1–0), while red values indicate a positive correlation (rho 0–1). Raw values can be found in supplementary data S4–5. Only study participants with matching feces and plasma samples were include in the analysis.
Supplemental Material
Download MS Excel (185.5 KB)Supplemental Material
Download MS Word (2.9 MB)Data availability statement
The 16S rRNA sequencing data that support the findings of this study, are freely available in NCBI SRA at https://www.ncbi.nlm.nih.gov/bioproject/?term=PRJNA701402, Bioproject ID PRJNA701402.