Clement Davida Department of Pathology and Immunology, Faculty of Medicine, University of Geneva, Geneva, Switzerland;b Geneva Centre for Inflammation Research, Faculty of Medicine, University of Geneva, Geneva, SwitzerlandView further author information
,
Aleksander Czaudernaa Department of Pathology and Immunology, Faculty of Medicine, University of Geneva, Geneva, Switzerland;b Geneva Centre for Inflammation Research, Faculty of Medicine, University of Geneva, Geneva, SwitzerlandView further author information
,
Liqing Chenga Department of Pathology and Immunology, Faculty of Medicine, University of Geneva, Geneva, Switzerland;b Geneva Centre for Inflammation Research, Faculty of Medicine, University of Geneva, Geneva, SwitzerlandView further author information
,
Marion Lagunea Department of Pathology and Immunology, Faculty of Medicine, University of Geneva, Geneva, Switzerland;b Geneva Centre for Inflammation Research, Faculty of Medicine, University of Geneva, Geneva, SwitzerlandView further author information
Eric G. Pamerc Immunology Program, Sloan Kettering Institute, Memorial Sloan-Kettering Cancer Center, New York, NY, USA;d Duchossois Family Institute, University of Chicago, Chicago, IL, USAView further author information
Simone Becattinia Department of Pathology and Immunology, Faculty of Medicine, University of Geneva, Geneva, Switzerland;b Geneva Centre for Inflammation Research, Faculty of Medicine, University of Geneva, Geneva, SwitzerlandCorrespondence[email protected] View further author information
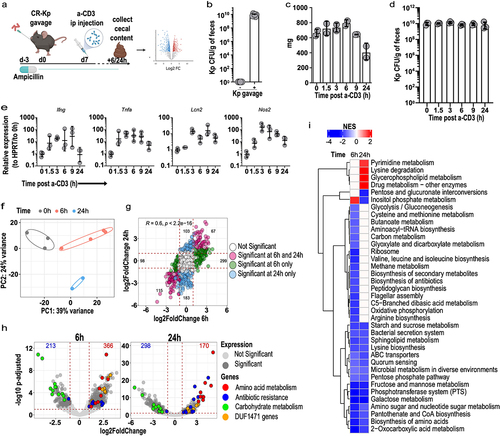
a) Schematic representation of the experimental layout. Mice were treated with ampicillin in drinking water for 3 days and reconstituted with CR-Kp by oral gavage. Seven days later, mice were injected i.p. with anti-CD3 (a-CD3) antibody (100 μg). 6h or 24 h following injection, mice were sacrificed, and RNA was extracted from cecal contents for sequencing.
b) Fecal burden of CR-Kp 24 h after gavage as measured by selective plating.
c) Weight of cecal content collected at the depicted time point following treatment (n = 3).
d) CR-Kp CFUs in cecal contents harvested at the indicated times following treatment and measured by selective plating (n = 3, one representative of 2 experiments shown).
e) Quantitative PCR for the depicted genes on cecal tissue harvested at the indicated time points following treatment (n = 3, shown are geometric means ± SD, one representative of 2 experiments shown).
f) PCA of CR-Kp transcriptome at the indicated time points following treatment (rlog-transformed counts (n = 2-4 per group).
g) Correlation plot depicting expression levels for CR-Kp expressed as log2 fold change between expression at 6 h or 24 h post anti-CD3 antibody administration as compared to baseline. Each dot corresponds to a gene, color code indicates: blue = significant DEG only at 24 h; green = significant DEG only at 6 h; pink = DEG significant in both; white = no significant differential expression. Significance was defined as adjusted pvalue < .05 and absolute log2 fold change > 1. Pearson’s correlation coefficient and p value are shown.
h) Volcano plot depicting changes in gene expression for CR-Kp at 6 h and 24 h following anti-CD3 antibody treatment, relative to baseline. DEG are shown in dark gray. Selected categories of significant DEG are highlighted as follow: amino acid metabolism = red, antibiotic resistance = blue, carbohydrate metabolism = green, DUF1471-domain protein-encoding genes = orange.
g) Gene Set Enrichment Analysis (GSEA) of the dataset presented in . Shown are KEGG categories that were significantly enriched (adjusted pvalue < .05), color represents net enrichment score (NES).
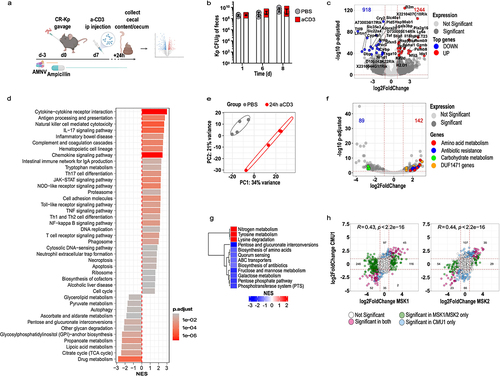
Figure 2. A dual-seq experiment validates mouse and CR-Kp transcriptional shifts following immune activation.
a) Schematic representation of the experimental layout. Mice were treated with AMNV (A = Ampicillin, M = Metronidazole, N = Neomycin, V = Vancomycin) and reconstituted with Kp for 7 days before getting injected i.p. with anti-CD3 antibody (100 μg). RNA was extracted from cecal content and tissue and sequenced (n = 4 per group).
b) Fecal burden of CR-Kp at the depicted time points following treatment, as measured by selective plating.
c) Representative volcano plot depicting mouse DEG at 24 h post anti-CD3 antibody treatment (as compared to time-matched PBS treatment). Genes DE are shown in dark gray. Non-DE are shown in light gray. Top 40 DE genes are highlighted as follow: red = 20 most up-regulated genes, blue = 20 most down-regulated genes.
d) GSEA of murine RNAseq data set. Shown are KEGG categories that were significantly enriched (adjusted p value < .05, color-coded), bars represents net enrichment score (NES).
e) PCA of CR-Kp transcriptome 24 h following treatment (rlog-transformed counts (n = 4 per group).
f) Volcano plot depicting changes in gene expression for CR-Kp 24 h following anti-CD3 antibody treatment, relative to time-matched PBS-treated controls. DEG are shown in dark gray. Selected categories of significant DEG are highlighted as follow: amino acid metabolism = red, antibiotic resistance = blue, carbohydrate metabolism = green, DUF1471-domain protein-encoding genes = orange.
g) (GSEA) of the dataset presented in . Shown are KEGG categories that were significantly enriched (adjusted p value < .05), color represents net enrichment score (NES).
h) Correlation plot depicting expression levels for CR-Kp expressed as log2 fold change between expression 24 h post anti-CD3 antibody administration as compared to baseline, in experiments MSK1 vs CMU1 and MSK2 vs CMU1. Each dot corresponds to a gene, color code indicates: blue = significant DEG only in CMU1; green = significant DEG only in MSK1/MSK2; pink = DEG significant in both; white = no significant differential expression. Significance was defined as adjusted p value < .05 and absolute log2 fold change > 1. Pearson’s correlation coefficient and p value are shown.
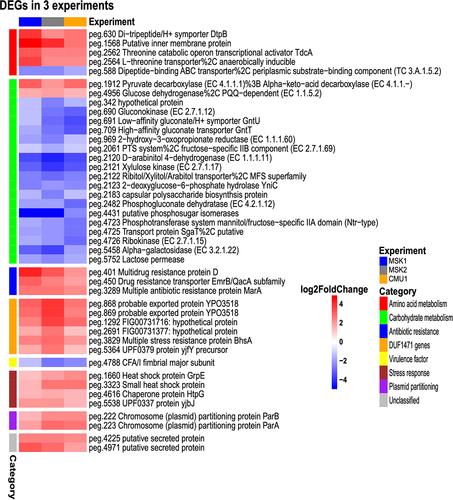
Figure 3. Identification of a robust transcriptional signature of CR-Kp adaptation to intestinal immunity.
(a) Heatmap depicting log 2-fold change expression levels for genes concordantly up- or down-regulated by CR-Kp in response to immune activation in three different experiments (MSK1, MSK2, CMU1) carried out in 2 different vivaria. Functional annotation is shown on the left and it is based on PATRIC subsystem, gene level. Category annotation was curated manually.
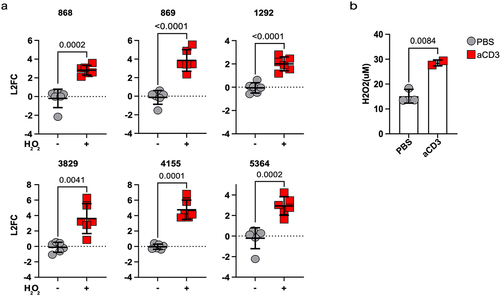
Figure 4. DUF1471 protein-encoding genes can be up-regulated by reactive oxygen species.
(a) Quantitative PCR for the depicted genes performed on WT Kp harvested at 30 min following exposure to sub-lethal concentrations of H2O2 (i.e. 1.25 mM) (n = 6 from 3 independent experiments, shown are means ± SD, Multiple unpaired t-test with Welch’s correction, p < .05).
(b) Quantification of H2O2 in the cecum of WT mice measured with a colorimetric assay at the depicted time point post-injection of anti-CD3 (n = 2-3 per group; shown 1 representative of 2 experiments; unpaired t-test).
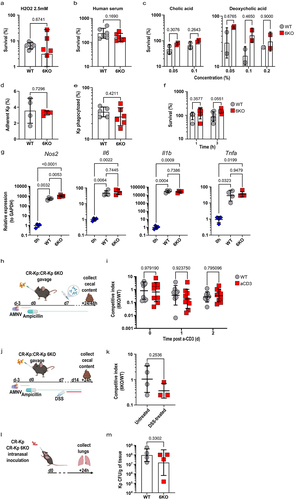
Figure 5. Absence of 6 DUF1471 protein-encoding genes does not affect the fitness and the virulence of Klebsiella pneumoniae in-vitro and in-vivo.
(a) Survival of the indicated CR-Kp strains exposed to 2.5 mM H2O2 for 1 h. Survival is expressed as percentage of recovered CFUs relative to initial inoculum (n = 6 from 2 independent experiments, shown are geometric means ± SD; unpaired t-test, p < .05).
(b) Survival of the indicated CR-Kp strains exposed to human serum for 1 h. Survival is expressed as percentage of recovered CFUs relative to initial inoculum (n = 6 from 2 independent experiments, shown are geometric means ± SD; unpaired t-test, p < .05).
(c) Survival of the indicated CR-Kp strains grown overnight at 37°C on LB-agar plates supplemented with cholic acid (0.05%, 0.1%) or deoxycholic acid (0.05%, 0.1%, 0.2%). Survival is expressed as percentage of recovered CFUs relative to initial inoculum (n = 2, shown are geometric means ± SD; 2-way ANOVA, p < .05).
(d) Proportion of Kp adherent to HEK293T cells after 1 h incubation at 37°C. Proportion is expressed as percentage of CFUs recovered after extensive cell wash, relative to initial inoculum (n = 4, shown are means ± SD; unpaired t-test, p < .05).
(e) Proportion of Kp phagocytosed by RAW264.7 macrophages after 1 h incubation. Proportion is expressed as percentage of CFUs recovered after extensive cell wash and gentamycin treatment, relative to initial inoculum (WT, n = 5, 6KO n = 6, shown are geometric means ± SD; unpaired t-test, p < 0.05).
(f) Survival of the indicated Kp strains phagocytosed RAW264.7 macrophages for 1 h or 3 h post gentamicin wash at 37°C. Survival is expressed as percentage of the CFUs recovered after incubation, as compared to cells phagocytosed at t = 0 (n = 6, shown are geometric means ± SD; 2-way ANOVA, p < .05).
(g) Quantitative PCR for the depicted genes on RAW264.7 macrophages harvested at the indicated times following exposure to CR-Kp (n = 4, shown are geometric means ± SD, 1-way ANOVA, p < .05).
(h) Experimental layout. Mice were treated with AMNV (A = Ampicillin, M = Metronidazole, N = Neomycin, V = Vancomycin) and reconstituted with a consortium consisting of a 1:1 ratio of WT:6KO CR-Kp for 7 days before getting injected i.p. with anti-CD3 (a-CD3) antibody (100 μg). Bacterial genomic DNA was extracted from cecal contents of animals reconstituted.
(i) Quantitative PCR with strain-specific primers was performed on the DNA obtained in (h) to calculate the competitive index between the WT Kp and the 6KO Kp at the indicated time points (n = 9 from 2 independent experiments, shown are geometric means ± SD, 2-way ANOVA, p < .05).
(j) Experimental layout. Mice were treated with AMNV (A = Ampicillin, M = Metronidazole, N = Neomycin, V = Vancomycin) and reconstituted with a consortium consisting of a 1:1 ratio of WT:6KO CR-Kp for 7 days before getting treated with Dextran Sodium Sulfate (DSS) (3%) for 7 days. Bacterial genomic DNA was extracted from cecal contents of animals reconstituted.
(k) Quantitative PCR with strain-specific primers was performed on the DNA obtained in (J) to calculate the competitive index between the WT Kp and the 6KO Kp at the indicated time points (n = 4, shown are geometric means ± SD, unpaired t-test, p < .05).
(l) Experimental layout. Mice were intranasally inoculated with either WT or 6KO CR-Kp. 24 h post inoculation, CR-Kp burden in the lung tissue was determined by selective plating and CFU enumeration.
(m) Pulmonary levels of WT and 6KO CR-Kp obtained from (l) (n = 4, shown are geometric means ± SD, unpaired t-test, p < .05).
Figure 6. Major metabolic shifts are observed in the gut lumen during inflammation.
Barplot depicting the levels of polar metabolites detected in the intestinal lumen expressed as concentration fold change in the cecal content of anti-CD3 vs PBS-injected animals (at 5 h). Each bar corresponds to one metabolite(shown are means ± SD; 1-way ANOVA, ns p > .05, *p ≤ .05, **p ≤ .01, ***p ≤ .001).
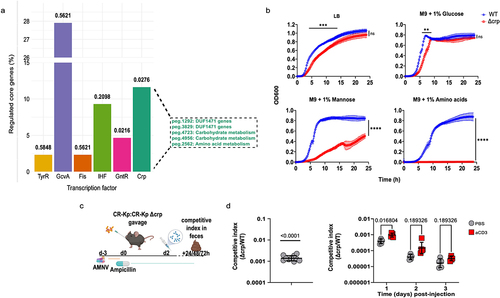
Figure 7. CRP is an important regulator of CR-Kp intestinal colonization but is dispensable for adaptation to inflammation.
(a) Barplot depicting the percentage of core differentially expressed genes regulated by the top enriched transcription factors, based on adjusted p-value. On the right are showed the core differentially expressed genes regulated by CRP and their affiliated metabolism (hypergeometric test, p < .05).
(b) In-vitro growth of Δcrp Kp and WT Kp were measured via optical density reading every 15 min for 24 h in aerobic conditions (shown are means ± SD, Multiple unpaired t-test with Welch’s correction, ns p > .05, * p ≤ .05, ** p ≤ .01, *** p ≤ .001, **** p ≤ .0001).
(c) Schematic representation of the experimental layout. Mice were treated with AMNV (A = Ampicillin, M = Metronidazole, N = Neomycin, V = Vancomycin) and reconstituted with Kp for 2 days before getting injected i.p. with anti-CD3 antibody (100 μg). DNA was extracted from fecal pellets just before injection and at 24 h, 48 h and 72 h post-injection (n = 5 per group).
(d) Competitive index between Δcrp and WT Kp as measured by qPCR in feces at the indicated time points following co-administration of the 2 strains via oral gavage. Left: competitive index 24 h post-gavage (n = 10, shown are geometric means ± SD, one-sample t-test vs theorical value of 1.0). Right: competitive index at the indicated time points post PBS or anti-CD3 injection (n = 5 from 1 representative experiment of 2 performed, shown are geometric means ± SD, Multiple unpaired t-test with Welch’s correction, p < .05).