
Figures & data
Figure 1. Identification of FMT recipient factors that predict HOMA-IR responses by machine learning.
Line graphs show differences in the effects of (a) FMT with fiber supplementation on HOMA-IR for responders and non-responders, as defined according to changes in HOMA-IR from baseline to week 6 (decreased vs. increased). AUC-ROC values show the performance accuracy of random forest classifiers for predicting responders from non-responders in (b) FMT with fiber supplementation induced HOMA-IR attenuation. Prediction performance of random forest classifiers trained to predict FMT plus fiber responders in HOMA-IR. (c) (left) AUC-ROC curves show the performance accuracy of random forest classifiers trained to predict responders vs. non-responders for HOMA-IR with FMT plus fiber treatment using the relative abundance of the patient’s baseline fecal microbiota at genus level; (center) Horizontal bars represent the top 10 important taxa for predicting responses; (right) Horizontal bars represent taxa comparisons between responders and non-responders. * Indicates p value < .05 using Wilcoxon test. Δ, absolute change from baseline to week 6; AUC-ROC, area under the receiver operating characteristic curve; HOMA-IR, homeostatic model assessment of insulin resistance; FMT, Fecal microbiota transplant.
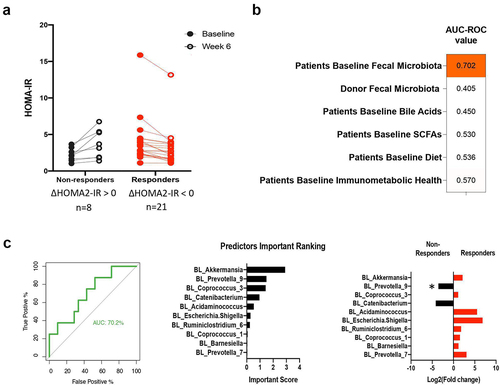
Figure 2. FMT recipient factors at baseline are associated with the differences in fecal microbiota changes in diversity between responders and non-responders in HOMA-IR.
(a) Microbial diversity is associated with improvement in HOMA-IR in patients receiving FMT with fiber supplementation. Analyzed using repeated measures linear mixed model regression after adjusting for donor selection. (b) Comparison of shifts in fecal alpha-diversity (Δ week 6 - baseline) between responders and non-responders, as defined according to changes in HOMA-IR from baseline to week 6 (decreased vs. increased). Statistical comparisons between groups were by ANCOVA adjusted for donor selection. (c) Scatter plots show recipient parameters that predict the changes in microbial diversity after FMT using baseline intakes of calorie-adjusted macronutrients and baseline clinical measurements including anthropometric measurements, immune cytokines, metabolic makers, and fecal bile acids (15 compounds), as well as biomarkers of host-microbiota interactions. Analyzed using repeated measures linear mixed model regression after adjusting for donor selection. LDL, low-density lipoprotein cholesterol; TMCA, tauro-muricholic acid.
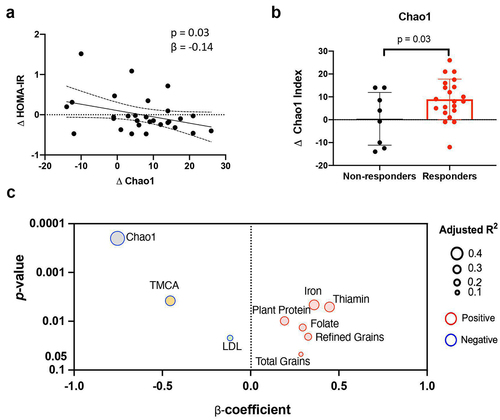
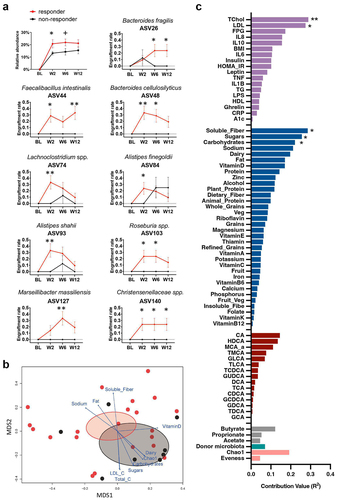
Figure 3. FMT recipient baseline factors predict donor-specific ASVs engraftment.
(a) Comparison of the donor-specific ASVs fraction retained in the FMT-recipients between responders and non-responders over the 12 weeks. Line charts compare the ratio of FMT recipients who retained donor-specific ASVs in total number of the recipients (engraftment rate) among responders vs. non-responders. ASVs that had a significantly higher engraftment rate in the responders relative to the non-responders were selected (p < .05). Statistical analysis was performed by repeated measures ANOVA models for assessing the main factor effect. Comparisons were made between the two groups at each time point by t-test with Welch correction. Data are reported as mean ± SEM [+p < .1, *p < .05, **p < .01]. ASV26: Bacteroides fragilis; ASV44: Faecalibacillus intestinalis; ASV48: Bacteroides cellulosilyticus; ASV74: Lachnoclostridium spp.; ASV84: Alistipes finegoldii; ASV93: Alistipes shahii; ASV103: Roseburia spp.; ASV127: Marseillibacter massiliensis; ASV140: Christensenellaceae spp. ASV, amplicon sequence variant. (b) Weighted metric multidimensional scaling based on Bray-Curtis dissimilarity and environmental fitting test analysis (envfit) displaying top 10 recipient baseline factors explaining donor-specific ASVs distribution variation between responders and non-responders at week 6. (c) The figure C evaluated contribution degrees of baseline factors affecting the donor-specific ASVs community in the FMT recipients (measured using coefficient of determination (R2)). And the significant association was tested using permutation test (n = 999) in the vegan package [*p < .05, **p < .01].
Supplemental material
Supplemental Material
Download Zip (1.8 MB)Data availability statement
The raw sequencing data have been deposited into the Sequence Read Archive (SRA) of the NCBI (http://www.ncbi.nlm.nih.gov/sra) under BioProject PRJNA708262. All other relevant data related to the current study are freely available from the corresponding author (K.L.M.) upon request, which does not include confidential patient information.