
Figures & data
Figure 1. Effect of inulin, pantoprazole and their combination on ESBL-E. coli fecal titers.
Note. (a) Experimental design. (b) Individual and mean fecal titers of ESBL-E. coli. (c) Distribution of AUC of the ESBL-E. coli titers between 1 and 8 dpi, all treatments together. From this distribution, limits for low and high AUCESBL-E. coli were set at 39 and 50 day∙log10CFU/g (dashed lines). (d) mean ESBL-E. coli titers and their 95% confidence interval, according to the group of AUCESBL-E. coli, all treatments together. (e) Distribution of AUCESBL-E. coli of the ESBL-E. coli titers between 1 and 8 dpi, according to the treatment.
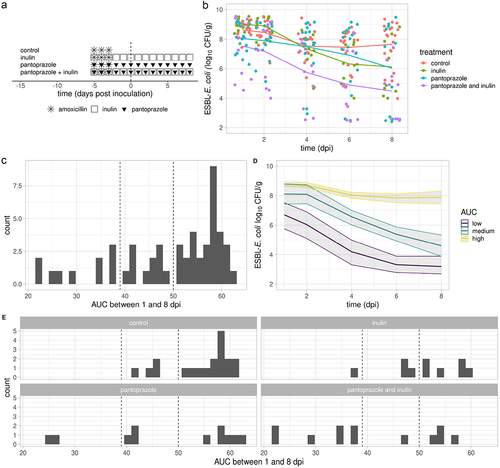
Figure 2. Taxonomic diversity and architecture of fecal microbiome in mice effectively treated by inulin and pantoprazole in comparison with control or ineffectively treated mice.
Note. (a), alpha-diversity, Shannon index. (b), alpha-diversity, observed species. (c) beta-diversity. Blue, control mice or mice ineffectively treated with inulin-pantoprazole; red, mice effectively treated with inulin-pantoprazole. Mice were classified as low (circles), medium (triangles) or high (squares) level of ESBL-E. coli colonization, according to the AUC of ESBL titers between 1 and 8 dpi (≤39, >39 and < 50, and ≥ 50 log10 CFU·day·g−1, respectively). Ineffective and effective treatments were defined by high or medium, and low levels of ESBL-E. coli colonization, respectively. 95% confidence ellipses of points
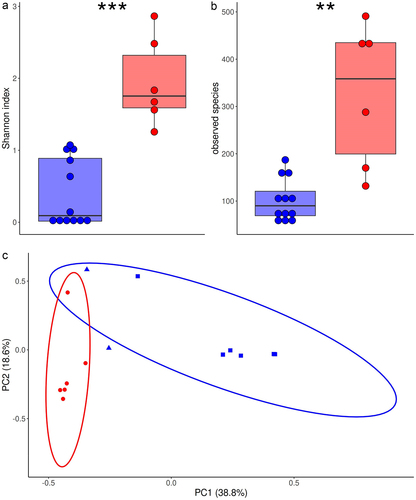
Figure 3. Preventive treatment with adlercreutzia caecimuris or adlercreutzia muris on ESBL-E. coli intestinal colonization.
Note. (a) Experimental design; (b) Effect of treatment with A. muris or A. caecimuris on relative abundance of five Adlercreutzia species just before ESBL-E. coli inoculation (c) Effect of treatment with A. muris, A. muris with inulin or A. caecimuris on ESBL-E. coli titers. Full line, mean titer.
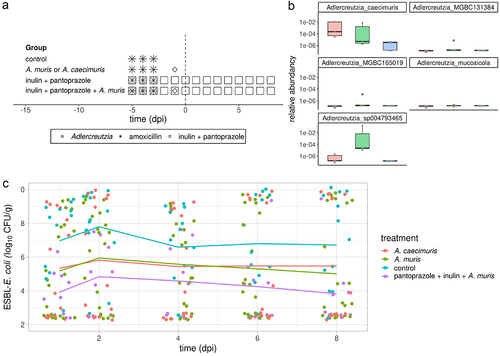
Figure 4. Metabolic pathways of fecal microbiota in mice effectively treated with inulin and pantoprazole vs control or ineffectively treated mice.
Note. Metabolic pathways were predicted from the MetaCyc Metabolic Pathways (a, b, c) and CAZy databases (d, e, f, g). (a and d), alpha-diversity, Shannon index. (b and e), alpha-diversity, observed species. (c and f) beta-diversity. 95% confidence ellipses of points. (g) abundance of fructan beta-fructosidase. Blue, control mice or mice ineffectively treated with inulin-pantoprazole; red, mice effectively treated with inulin-pantoprazole.
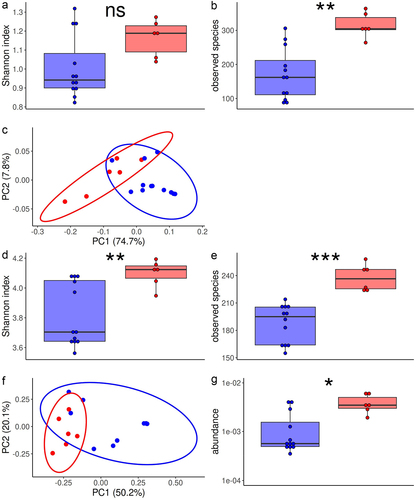
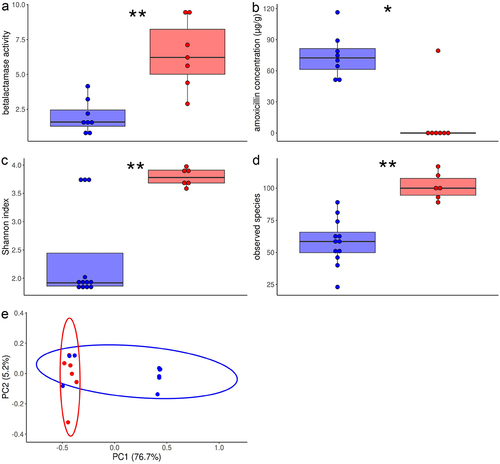
Figure 5. Fecal β-lactamase activity, amoxicillin concentration and resistome in mice effectively treated by inulin and pantoprazole and in control or ineffectively treated mice.
Note. (a) Fecal β-lactamase activity (nitrocefin test) in arbitrary units/g. (b) Fecal amoxicillin concentrations in µg/g. (c), alpha-diversity, Shannon index. (d), alpha-diversity, observed species. (e) beta-diversity. Blue, control mice or mice ineffectively treated with inulin-pantoprazole; red, mice effectively treated with inulin-pantoprazole. Mice were classified as low, medium or high level of ESBL-E. coli colonization, according to the AUC of ESBL titers (≤39, >39 and < 50, and ≥ 50 log10 CFU·day·g−1, respectively). Ineffective and effective treatments were defined by high or medium, and low levels of ESBL-E. coli colonization, respectively. 95% confidence ellipses of points.
Supplemental material