Figures & data
Figure 1. Testosterone concentration. (A) Control group, (B) orchiectomy group, (C) bicalutamide treatment group, and (D) goserelin treatment group. The data is presented as the mean ± standard error of the mean (SEM). * represents p < 0.05 compared to the control group.
Figure 2. Sexual behaviors. (A) Control group, (B) orchiectomy group, (C) bicalutamide treatment group, and (D) goserelin treatment group. The results are presented as the mean ± standard error of the mean (SEM). * represents p < 0.05 compared to the control group.
Figure 3. Immobility and climbing time. (A) Control group, (B) orchiectomy group, (C) bicalutamide treatment group, and (D) goserelin treatment group. The results are presented as the mean ± standard error of the mean (SEM). * represents p < 0.05 compared to the control group.
Figure 4. 5-Hydroxytryptamine (5-HT) and tryptophan hydroxylase (TPH). Photomicrographs showing TPH and 5-HT expressions in the dorsal raphe. The scale bar represents 100 µm. (A) Control group, (B) orchiectomy group, (C) bicalutamide treatment group, and (D) goserelin treatment group. The results are presented as the mean ± standard error of the mean (SEM). * represents p < 0.05 compared to the control group.
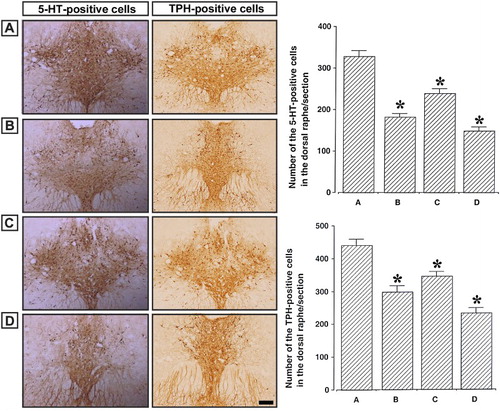
Figure 5. 5-Hydroxytryptamine-1A receptors (5-HT1AR) and tryptophan hydroxylase (TPH). (A) Control group, (B) orchiectomy group, (C) bicalutamide treatment group, and (D) goserelin treatment group. Data are presented as the means ± standard error of the mean (SEM). * represents p < 0.05 compared to the control group.