
Figures & data
Table 1. Correlation between cytoplasmic TIMP3 protein expression patterns and clinico-pathological features of OC
Figure 1. Immunohistochemical staining of cytoplasmic TIMP3 at 40X magnification: (A) Negative cytoplasmic expression, (B) Weak expression, (C) Moderate cytoplasmic expression, (D) Strong cytoplasmic expression
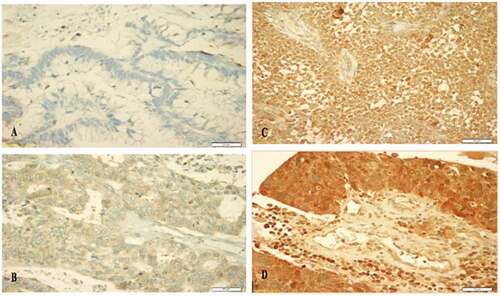
Figure 2. Cytoplasmic TIMP3 expression (0,1 vs 2,3) as determinant of disease specific survival (DSS) in univariate (Kaplan–Meier) analysis (p = 0.02, log rank)
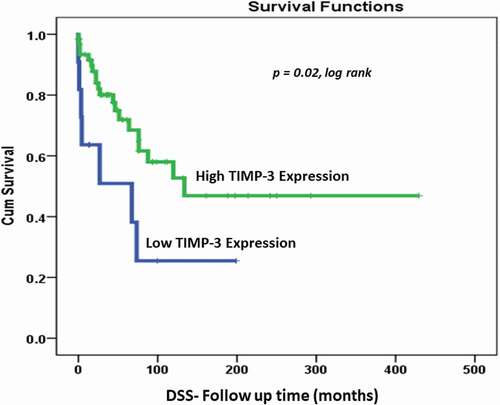
Figure 3. Cytoplasmic TIMP3 expression (0,1 vs 2,3) as determinant of disease-free survival (DFS) in univariate (Kaplan–Meier) analysis. (p = 0.42, log rank)
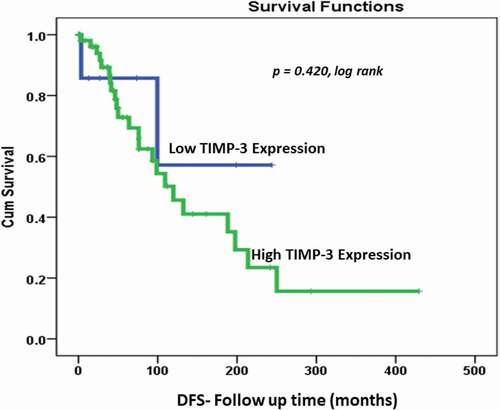
Table 2. Cox’s regression analysis of the prognostic values of TIMP3 protein expression pattern, age at diagnosis, histological subtypes, lymph node status, tumor stage and grade