
Figures & data
Table 1. Characteristics of participants (n = 137).
Table 2. Correlation between neutralizing and anti-S-RBD antibodies.
Figure 1. Antibody response over time following natural infection: a and c: illustrate the median value of the log-transformed anti-S-RBD IgG levels with the interquartile range; b and c: illustrate the median value of neutralizing antibodies with the interquartile range.
Figure 2. Kinetics of anti-SARS-CoV-2 antibodies over time in reinfected participants (n = 23).
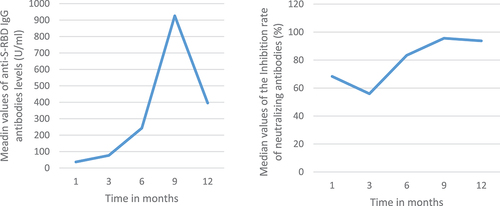
Table 3. Factors associated with reinfection: results of univariate analysis.
Figure 3. Antibody response over time following natural infection among non-reinfected participants: a and c: illustrate the median value of the log-transformed anti-S-RBD IgG levels with the interquartile range; b and c: illustrate the median value of neutralizing antibodies with the interquartile range.
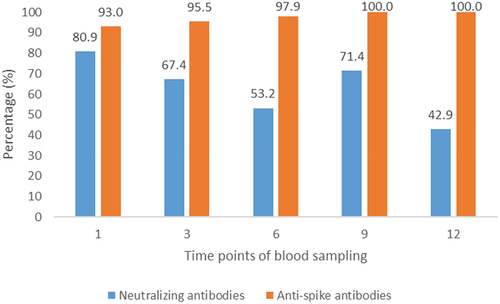
Figure 4. Percentage of detectable anti-spike and neutralizing antibodies over time (n = 47).
Data availability statement
The datasets used and/or analysed during the current study are available from the corresponding author on reasonable request.