Figures & data
Figure 1. Modulation of the expression of microRNAs (mRNAs) encoding cytokine signaling-3 (SOCS-3), interferon regulatory factor-1 (IRF-1), epidermal growth factor (EGF), EGF-receptor (EGFR), and signal transducers and activators of transcription (STAT-3) in human gingival epithelial cells (HGEC) infected with Porphyromonas gingivalis and activated by its lipopolysaccharide (LPS-Pg). (a) HGEC were infected for 2 h with P. gingivalis at different multiplicities of infection (MOI; 10 or 100) and with heat-killed P. gingivalis (Ina) at a MOI of 100. Uninfected cells served as control. (b) HGEC were activated for 2 h and 24 h by 0.5 µg/mL and 1 µg/mL of LPS-Pg. Unactivated cells served as controls. In both experiments, total RNA were prepared, and levels of mRNAs encoding SOCS-3, IRF-1, EGF, EGFR, and STAT-3 were determined by quantitative reverse transcription polymerase chain reaction analysis. All results were presented as the quantity relative to β-actin as a reference gene. Differences (*) between a test mRNA and the control HGEC were analyzed with Student’s t-test (p < 0.0005). All experiments were repeated three times, and the results are expressed as mean ± the standard deviation.
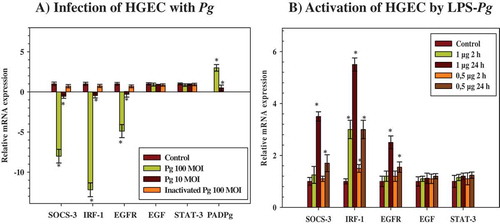
Figure 2. Modulation of the expression of SOCS-3, IRF-1, EGFR, and STAT-3 proteins in HGEC infected with P. gingivalis and activated by LPS-Pg. (a) HGEC were infected for 2 h with P. gingivalis at a MOI of 100 and with heat-killed P. gingivalis (Ina). Uninfected cells served as control (C). (b) HGEC were activated 2 and 24 h by 1 µg/mL of purified LPS-Pg. Non-activated cells served as controls (C). In both experiments, cellular extracts were prepared and analyzed by immunoblotting with antibodies to SOCS-3, IRF-1, EGFR, and STAT-3. No detection was obtained using an antibody raised against EGF (not shown). An antibody to GAPDH was used as an internal control to verify equal loading of total proteins in all wells. Histograms indicated the relative protein expression level during infection and activation. Levels were determined by pixel intensity of a protein band normalized to the intensity of the internal control GAPDH within the same assay. Differences (*) between a given ratio and the one obtained with control cells were analyzed with Student’s t-test (p < 0.0005).
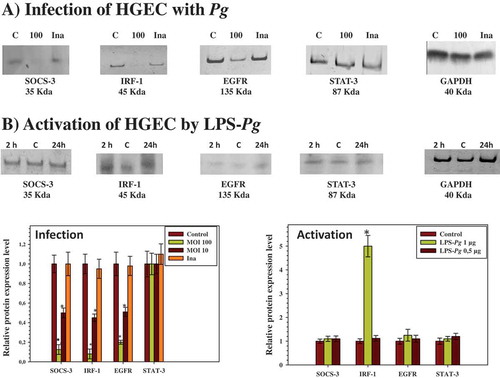
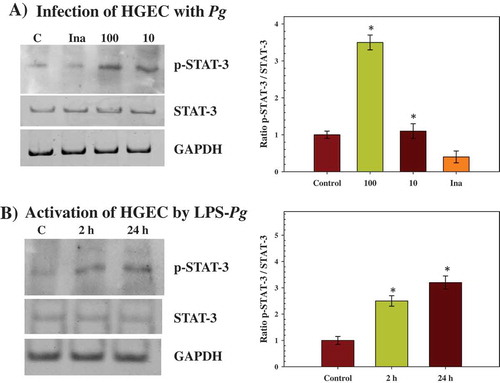
Figure 3. Effect of infection with P. gingivalis and activation by LPS-Pg of HGEC on the phosphorylation status of STAT-3 protein (p-STAT-3). (a) HGEC were infected for 2 h with P. gingivalis at a MOI of 100 and with heat-killed P. gingivalis (Ina). Uninfected cells served as control (C). (b) HGEC were activated for 2 and 24 h by 1 µg/mL of purified LPS-Pg. Non-activated cells served as controls (C). In both experiments, nuclear extracts were prepared and analyzed by immunoblotting with anti-phospho-STAT-3 (Tyr705) antibody to detect p-STAT-3 and with anti-STAT-3 antibody to reveal total STAT-3 protein. The antibody for GAPDH was used as an internal control to verify equal loading of proteins in all wells. Each band was quantified by densitomery and the band intensity obtained with anti-phospho-STAT-3 (Tyr705) antibody in an assay was expressed relative to the intensity of the band obtained with the antibody for total STAT-3 antigen in the same assay. Histograms showed changes of the ratio p-STAT-3/STAT-3 during infection and activation of HGEC. Differences (*) between a given ratio and the one obtained with control cells were analyzed with Student’s t-test (p < 0.0005). All experiments were repeated three times, and the results are expressed as mean ± the standard deviation.