
Figures & data
Figure 1. Oral virome composition profiles and core oral virome of RAs and HCs. (a) Pie chart depicting the viral species distribution at the phylum level in RAs and HCs. (b)Pie chart illustrating the family-level distribution of viral species in RAs and HCs (c) Heatmap of the core virome of RAs and HCs at the genus level (d) Heatmap of the core virome of RAs and HCs at the species level.
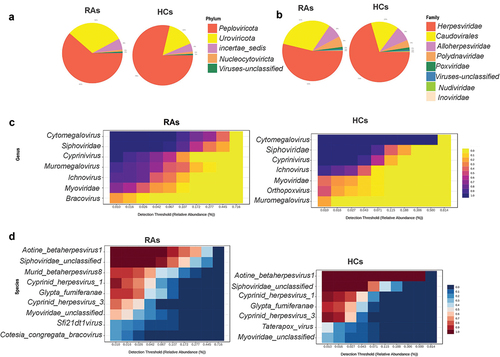
Figure 2. The oral virome richness and diversity and interpersonal variations in RAs and HCs. (a) Boxplot of alpha diversity of observed and Chao1, Shannon and Simpson’s indices reflect the abundance and diversity of species in the samples. (b) PERMANOVA-validated non-metric multidimensional scaling (NMDS) beta variety depicted with Bray-Curtis and Jaccard index distances.
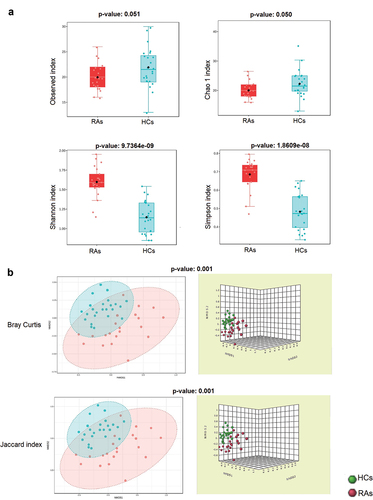
Figure 3. Oral viral signatures significantly different between RAs and HCs. (a) Linear discriminant analysis (LDA) effect size analysis (LEfSe) identified the most differentially abundant viral species between RAs and HCs (p < 0.05; LDA score 2). HCs-associated viral species are indicated with negative LDA scores (green), and RAs-associated viral species are indicated with positive LDA scores (red color). (b) pairwise Wilcoxon test for each significant viral signature identified by LEfSe analysis (p < 0.05).
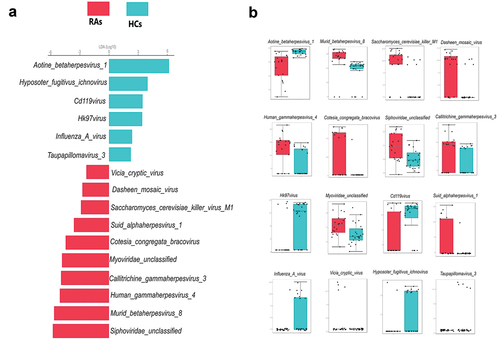
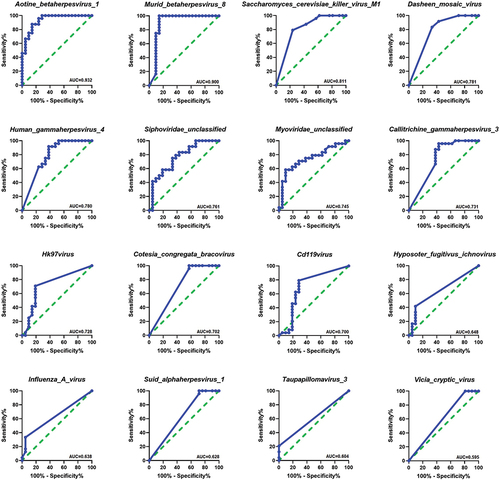
Figure 4. Receiver operating characteristics (ROC) analysis. (a) The area under curves (AUC) values obtained by ROC analysis, show the predictive power of the individual viral signature differs between RAs and HCs,(AUC; 95% CI).