Figures & data
Table 1. Antibody specifications.
Figure 1. Characterisation and quantification of platelet EVs. SSC-H over FSC-H colour dot plots: water and 200 beads/µl were recorded. Background noise (light blue) and bead gate (red) was set (a). Platelet EV suspensions without or with CaCl2 were recorded with a limit set on bead gate (b). Colour dot plots of platelet EV isotype control (blue) (c) and annexin A5/CD41a positive platelet EVs (green) (d). Size distribution of platelet EV suspensions measured by advanced nanoparticle tracking analysis (n = 10) (e).
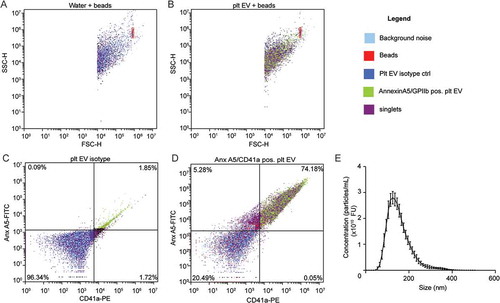
Figure 2. Cryo-transmission electron microscopy and bead coupled flow cytometry of platelet EVs. Representative micrographs from cryo-TEM of platelet EV suspensions. Scale bar 200 nm (a). Representative scatterplots and quantification of bead coupled flow cytometry for CD9 (b), CD63 (c) and CD81 (d) (n = 3).
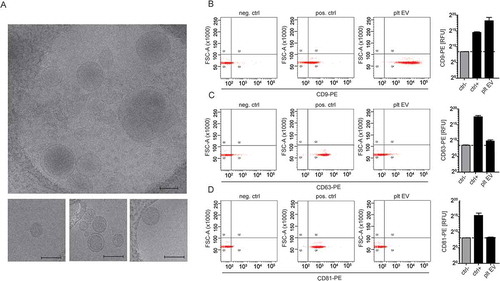
Figure 3. Platelet EVs interact with resting or TNFα stimulated SMC via platelet integrin αIIbβ3 or CX3CR1. CFSE-platelet EVs bound to SMC were measured by flow cytometry. Representative histograms of CFSE- platelet EVs bound to resting SMC in the presence of EDTA (filled histogram) or CaCl2 (line histogram) (a). CFSE-labelled platelet EVs (2 × 10⁸/ml) were co-incubated with resting or TNFα-stimulated SMC in presence or absence of indicated inhibitors (eptifibatide, F1-Fk, P-selectin inhibitor) or blocking antibodies (CD40L) for 30 min at room temperature. Median fluorescence intensity of CFSE-platelet EV bound to resting (b) or TNFα-stimulated SMC (c) and platelet receptors implicated in platelet EV–SMC interaction. p-values were calculated by ANOVA with Sidak’s post-test (n = 3–7).
Figure 4. Platelet EVs change SMC morphology. Micrographs of SMC stained with antibodies against F-actin (a), αSMA (b) or calponin (c) after control, platelet EV-, PDGF- or CXCL4-stimulation for 96 h. Nuclei were stained with DAPI. Scale bars: 50 µm. Cell surface area (µm2) (d,e) and corrected total cell fluorescence (CTCF) (f) were quantified and displayed as bar graphs or box-and-whiskers plots, respectively. p-values were calculated by ANOVA with Tukey’s (d,e) or Kruskal–Wallis (f) post-tests (n = 3).
Figure 5. Platelet EVs induce migration and proliferation of SMC. Proliferation of SMC was measured following platelet EV–SMC co-incubation in absence and presence of indicated blocking antibodies; n = 3 (a). SMC migration was assessed in a Boyden chamber in the presence of medium, Glioma-EV, platelet EVs, SEC-platelet EVs, PDGF, CXCL4, CCL5 or CD40L; n = 4–12 (b) or blocking antibodies (PDGF), heparin or heparinase III; n = 3–8 (c). Dose-dependent SMC migration of CXCL4 reconstituted platelet EVs (d). P-values were calculated by ANOVA with Tukey’s post-test.
Figure 6. Platelet EVs increase monocytic cell adhesion and cytokine release. SMC were incubated without or with platelet EV or CD40L in the presence of indicated inhibitors (P-selectin inhibitor, eptifibatide, F1-Fk) or blocking antibody (α-CD40L). Syto13 fluorescently labelled THP-1 were perfused at 0.15 ml/min (3 dynes/cm2) and adherent cells were quantified in six different fields; n = 5–9 (a). Representative micrographs of THP-1 cells adherent to non- or platelet EV-stimulated SMC (b). SMC were incubated with indicated agonists for 24 h and IL-6 release was measured by ELISA; n = 6 (c). P-values were calculated by ANOVA with Tukey’s post-test. Scale bar: 100 µm.
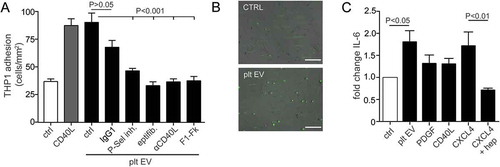
Figure 7. Proteomic analysis of platelet EV preparations. Venn diagram shows 549 identified proteins from which 344 proteins overlap with the in total 936 identified proteins of vesiclepedia (a). Pathway analysis identified proteins involved in biological processes (b).