Figures & data
Table 1. Method for preparing depleted FBS. Prices are without working hour’s costs for hands-on work.
Table 2. Culture media formulation overview.
Figure 1. EV concentration and size distribution by nanoparticle tracking analysis (NTA). Concentrations (particles/ml of original FBS) are shown in the y-axis and the different EV-depleted FBS and regular FBS samples on the x-axis. The UF-dFBS and commercial EV-depleted FBS (SBI-dFBS) contained fewer particles than the UC-dFBS or regular FBS. The dots depict measurements from technical replicates, and bars show means. FBS (fetal bovine serum), UC (ultracentrifugation), UF (ultrafiltration), SBI (System Biosciences), dFBS (EV-depleted FBS).
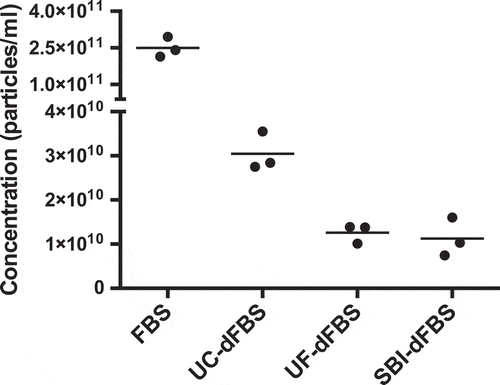
Figure 2. Electron microscopy of EV-depleted and regular FBS. Electron microscopy revealed that EVs were absent only in the UF-dFBS. EVs were isolated by UC from the different EV-depleted FBS and regular FBS. EV preparations were derived from (a) UF-dFBS lacked EVs, whereas (b) UC-dFBS and (c) commercial dFBS (SBI-dFBS) preparations showed mainly small EVs or EV-like particles. (d) Regular FBS contained both small and large EVs. Arrowheads mark examples of the EVs detected in the samples. The scale bar (500 nm) applies to all images. FBS (fetal bovine serum), UC (ultracentrifugation), UF (ultrafiltration), SBI (System Biosciences), dFBS (EV-depleted FBS).
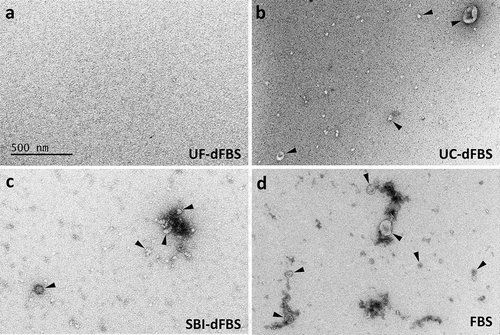
Figure 3. Silver staining and Western blotting of EV proteins. Analysis of total EV-protein and EV-marker proteins Hsp70 and CD71. EVs were isolated by UC from the different EV-depleted FBS and regular FBS. (a) Silver staining of EV proteins derived from regular FBS shows a distinct protein pattern that can also be detected in UC-dFBS, commercial dFBS (SBI-dFBS) and UF-dFBS retentate, but not in the UF-dFBS. (b) Western blotting detected Hsp70 and CD71 in EV preparations derived from regular FBS, UC-dFBS, SBI-dFBS and UF-dFBS retentate. In contrast, only a faint band of CD71 and no Hsp70 could be detected in EV preparations from UF-dFBS. FBS (fetal bovine serum), UC (ultracentrifugation), UF (ultrafiltration), SBI (System Biosciences), dFBS (EV-depleted FBS).
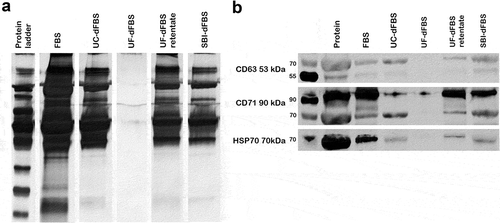
Figure 4. Bioanalyzer profiles of small RNA (miRNA and small RNA, 6–150 nt) from different EV-depleted FBS. (a) RNA was extracted from the EVs isolated from the FBS, dFBS and UF-dFBS retentate. (b) RNA was extracted from the total FBS and dFBS (without prior EV isolation) or from UF-dFBS retentate. As compared with the other dFBS, the UF-dFBS showed no EV-RNA signal, whereas some RNA was detected from the total UF-dFBS, indicating its non-vesicular origin. All other samples contained EV- and total FBS-RNA. FBS (fetal bovine serum), UC (ultracentrifugation), UF (ultrafiltration), SBI (System Biosciences), dFBS (EV-depleted FBS).
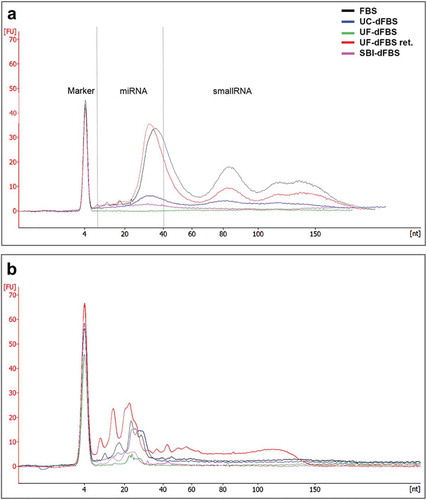
Table 3. Surface marker expression (%) of undifferentiated AT-MSCs analysed by flow cytometric analysis.
Figure 5. Morphological characterization of adipose-tissue derived mesenchymal stem cells by light microscopy after culturing in the test media for 48 h and 96 h. No differences could be detected in the size or shape between the different culturing conditions when monitored for up to 96 h. The spindle-shaped body of cells could be observed in all images and time points. Scale bars are 100 µm. FBS (fetal bovine serum), UC (ultracentrifugation), UF (ultrafiltration), SBI (System Biosciences), dFBS (EV-depleted FBS).
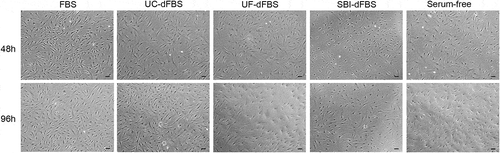
Figure 6. Cell proliferation and metabolic activity of AT-MSCs and cancer cell lines in test media. Metabolic activity per cell, i.e. cell proliferation, was calculated by the ratio of CCK8/CyQuant. (a) Adipose-tissue mesenchymal stem cells (AT-MSCs) showed a similar proliferation rate in FBS and UC-dFBS media between 48 h and 96 h, which was somewhat higher than in UF-dFBS and SBI-dFBS media. No marked proliferation was detected in the serum-free conditions. Each dot represents a biological replicate, and bars show means. (b) Proliferation rate of three different cancer cell lines (HSC3, PC-3, HOS143b) in FBS and dFBS media were assessed at 48 h and 96 h. UF-dFBS had a stimulatory effect on the proliferation of all three cancer cell lines. Each dot represents a technical replicate, and bars represent means. FBS (fetal bovine serum), UC (ultracentrifugation), UF (ultrafiltration), SBI (System Biosciences), dFBS (EV-depleted FBS).
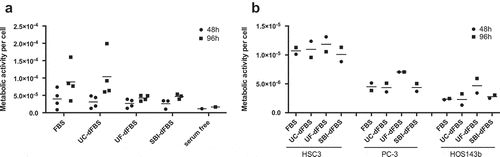
Figure 7. Evaluation of H2O2 formation in AT-MSCs grown in FBS, UC-dFBS, UF-dFBS and serum-free culture conditions after 24 h and 48 h. After 48 h, a significant difference was seen between the serum-free and regular FBS media (*p < 0.05), as well as between the serum-free and UC-dFBS media (*p < 0.05). Dots represent biological and technical replicates, and bars represent means. AT-MSCs (adipose-tissue mesenchymal stem cells), FBS (fetal bovine serum), UC (ultracentrifugation), UF (ultrafiltration), dFBS (EV-depleted FBS).
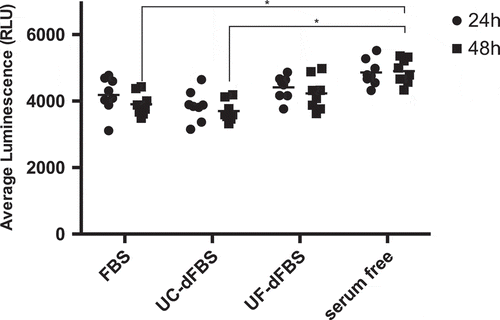
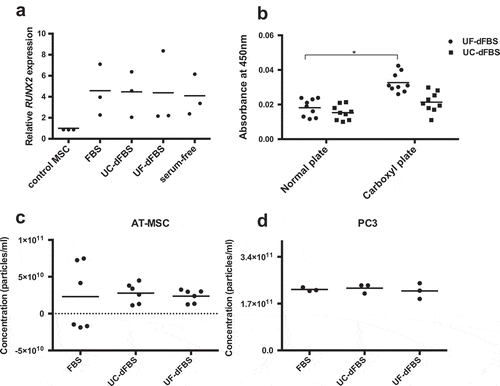
Figure 8. Differentiation capacity and improvement of metabolic activity of AT-MSCs cultured in EV-depleted FBS media. (a) Real-time quantitative PCR analysis of RUNX2 expression of AT-MSCs cultured in dFBS media followed by osteogenic differentiation showed that the cells retained their osteogenic differentiation capacity. Dots represent biological replicates, and bars represent means. (b) Compared with normal cell-culture plates, carboxyl plates enhanced the metabolic activity, CCK8 of cells cultured in UF-dFBS (*p < 0.05) and in UC-dFBS up to 48 h. Dots represent biological and technical replicates and bars represent mean. (c) Nanoparticle tracking analysis showed an equal production of EVs by AT-MSCs and (d) PC-3 cells cultured in the FBS and dFBS media. Dots represent biological and technical replicates, and bars represent the means. AT-MSCs (adipose-tissue mesenchymal stem cells), FBS (fetal bovine serum), UC (ultracentrifugation), UF (ultrafiltration), dFBS (EV-depleted FBS).