Figures & data
Table 1. Examples of value-based assessment tools available in the USA.
Table 2. ‘Contextual considerations’ and ‘Other Benefits or Disadvantages’ as considered in ICER’s value assessment framework.
Figure 1. Threshold values used for cost per incremental QALY in ICER’s value assessment framework.
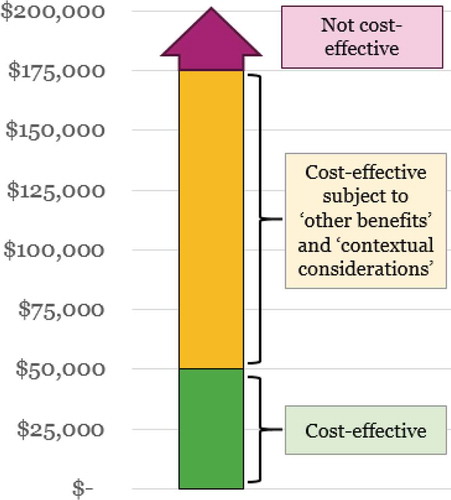
Table 3. Key features of the Markov model used.
Figure 2. Health states and transitions in the health economic model.
‘OFF’1: 0–25% of waking hours spent in ‘off’ state‘OFF’2: 25–50% of waking hours spent in ‘off’ state‘OFF’3: 50–75% of waking hours spent in ‘off’ state‘OFF’4: > 75% of waking hours spent in ‘off’ state
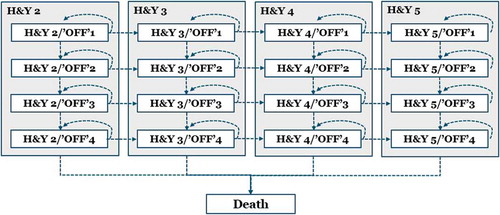
Table 4. Patient baseline and efficacy scenarios.
Figure 3. Graphical illustration of the (UK) costs and disutilities associated with the health states in the model (except deathFootnote2).
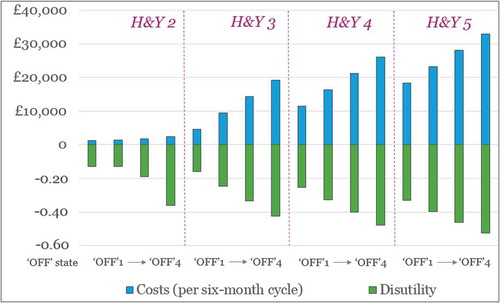
Figure 4. Comparison of estimated maximum cost-effective prices for the gene therapy in the US and England, for patients with H&Y3 and > 75% ‘OFF’ time at baseline (assuming five years duration of effect).
* English results are adjusted for the average £-to-$ exchange rate for 2017 (1.29) [Citation68] to allow the comparison (original results shown in GBP in parentheses)
![Figure 4. Comparison of estimated maximum cost-effective prices for the gene therapy in the US and England, for patients with H&Y3 and > 75% ‘OFF’ time at baseline (assuming five years duration of effect).* English results are adjusted for the average £-to-$ exchange rate for 2017 (1.29) [Citation68] to allow the comparison (original results shown in GBP in parentheses)](/cms/asset/fff5b11b-7cda-45ae-9ef0-16f7f2b9b2a9/zjma_a_1500419_f0004_oc.jpg)
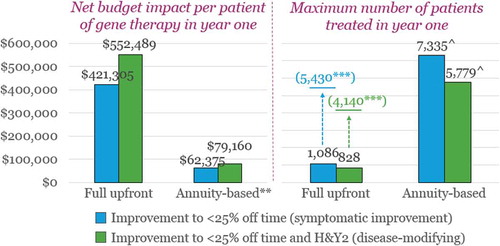
Figure 5. Maximum number of English patients eligible for treatment in year one according to the max prices identified* for patients with H&Y3/’OFF’4 at baseline and the £20-million budget impact threshold.
* £198,556 per patient for partial response; £250,264 per patient for optimal response** £39,711 per patient (£198,556/5 years) for partial response; £50,053 per patient (£250,264/5 years) for optimal response*** Over five years^ Maximum number of patients in years one through five (as the annuity payments are split over five years)
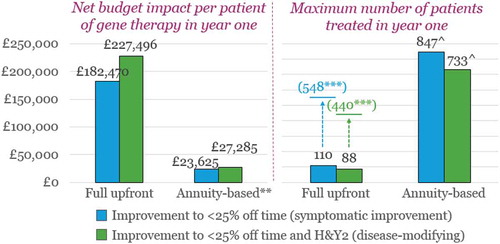
Figure 6. Maximum number of US patients eligible for treatment in year one according to the max prices identified* for patients with H&Y3/’OFF’4 at baseline and the $457.5-million budget impact threshold.
* $448,662 per patient for partial response; $591,662 per patient for optimal response** $ 89,732 per patient ($448,662/5 years) for partial response; $118,332 per patient ($591,662/5 years) for optimal response*** Over five years^ Maximum number of patients in years one through five (as annuity payments are split over five years)