
Figures & data
Table 1. Mean, standard deviation, and minimum and maximum values of each characteristic in study 1.
Table 2. Means and Standard Deviations of RAT Problem-Solving Accuracy and Solution Time for Each Condition in Study 1.
Table 3. Summary of the Models on RAT Problem-Solving Accuracy in Study 1 (Task Characteristics Measured Using Associative Strength; Best-Fitting Model in Bold).
Table 4. Summary of the Models on RAT Problem-Solving Accuracy in Study 1 (Task Characteristics Measured Using Semantic Similarity; Best-Fitting Model in Bold).
Table 5. Details of the Best-Fitting Model on RAT Problem-Solving Accuracy in Study 1(Task Characteristics Measured Using Associative Strength).
Table 6. Details of the Best-Fitting Model on RAT Problem-Solving Accuracy in Study 1 (Task Characteristics Measured Using Semantic Similarity).
Figure 1. Regression Coefficient of the Cue-Answer Associative Strength When the Number of Competing Associates was Low, Medium, and High (Study 1).
Note. OR = Odds Ratio. The estimated logit coefficients were transformed to odds ratios for easier interpretation.
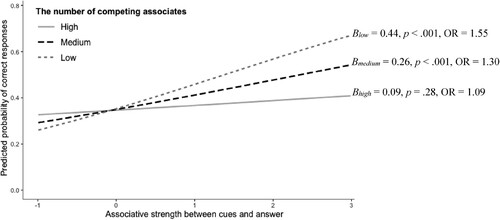
Figure 2. Regression Coefficient of Cue-Answer Semantic Similarity When Cue-Cue Semantic Similarity was Low, Medium and High (Study 1).
Note: OR = Odds Ratio. The estimated logit coefficients were transformed to odds ratios for easier interpretation.
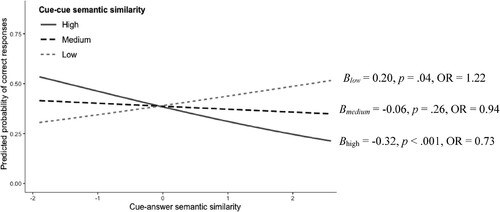
Table 7. Summary of the Models on RAT Problem-Solving Solution Time in Study 1 (Task Characteristics Measured Using Associative Strength).
Table 8. Summary of the Models on RAT Problem-Solving Solution Time in Study 1 (Task Characteristics Measured Using Semantic Similarity; Best-Fitting Model in Bold).
Table 9. Details of the Best-Fitting Model on RAT Problem-Solving Solution Time in Study 1 (Task Characteristics Measured Using Semantic Similarity).
Figure 3. The Regression Coefficient of Cue-Answer Semantic Similarity When Cue-Cue Semantic Similarity was Low, Medium, and High (Study 1).
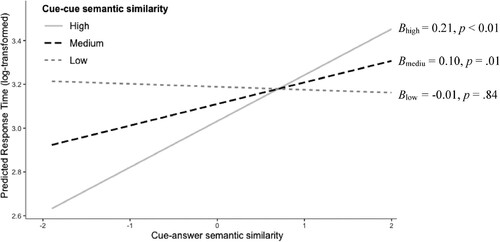
Table 10. Mean and Standard Deviation of Semantic Similarity Score for Each Condition in Study 1.
Table 11. Summary of the Model on Semantic Similarity Scores for Adjacent Responses in Study 1.
Table 12. Mean, Standard Deviation, and Minimum and Maximum Values of Each Characteristic in Study 2.
Table 13. Means and Standard Deviations of RAT Problem-Solving Accuracy and Solution Time for Each Condition in Study 2.
Table 14. Summary of the Models on RAT Problem-Solving Accuracy in Study 2 (Task Characteristics Measures Estimated Based on Associative Strength; Best-Fitting Model in Bold).
Table 15. Summary of the Models on RAT Problem-Solving Accuracy in Study 2 (Task Characteristics Measures Estimated Based on Semantic Similarity).
Table 16. Details of the Best-Fitting Model on RAT Problem-Solving Accuracy in Study 2 (Task Characteristics Measured Using Associative Strength).
Table 17. Details of the Best-Fitting Model on RAT Problem-Solving Accuracy in Study 2 (Task Characteristics Measured Using Semantic Similarity).
Figure 4. Regression Coefficient of Cue-Answer Associative Strength When the Number of Competing Associates was Low, Medium, and High (Study 2).
Note: OR = Odds Ratio. The estimated logit coefficients were transformed to odds ratios for easier interpretation.
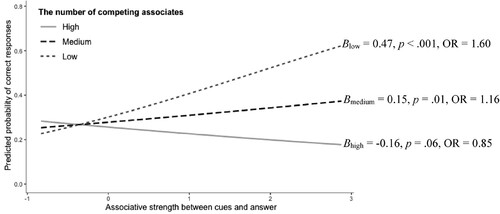
Figure 5. Regression Coefficient of Cue-Answer Semantic Similarity When the Cue-Cue Semantic Similarity was Low, Medium, and High (Study 2).
Note: OR = Odds Ratio. The estimated logit coefficients were transformed to odds ratios for easier interpretation.
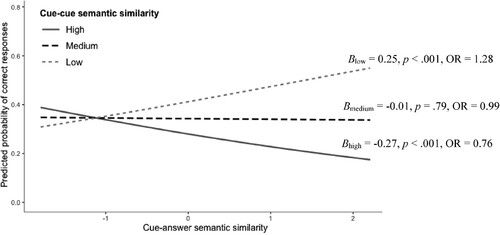
Table 18. Summary of the Models on RAT Problem-Solving Solution Time (Task Characteristics Measured Using Associative Strength) in Study 2.
Figure 6. Regression Coefficient of Cue-Answer Semantic Similarity When the Cue-Cue Semantic Similarity was Low, Medium, and High (Study 2).
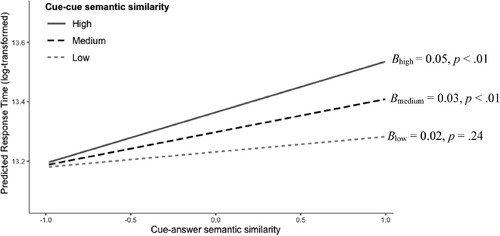
Table 19. Summary of the Models on RAT Problem-Solving Solution Time (Task Characteristics Measured Using Semantic Similarity; Besting-Fitting Model in Bold) in Study 2.
Table 20. Details of the Best-Fitting Model on RAT Problem-Solving Solution Time (Task Characteristics Measured Using Semantic Similarity) in Study 2.
Table 21. Mean and Standard Deviation of Semantic Similarity Score for Each Condition in Study 2.
Table 22. Summary of the Model on Semantic Similarity Scores of Adjacent Responses in Study 2.
Supplemental Material
Download MS Word (273.6 KB)Data availability statement
The data that support the findings of this study and the syntax files are openly available in Open Science Framework at: https://osf.io/uhxq9/.