Figures & data
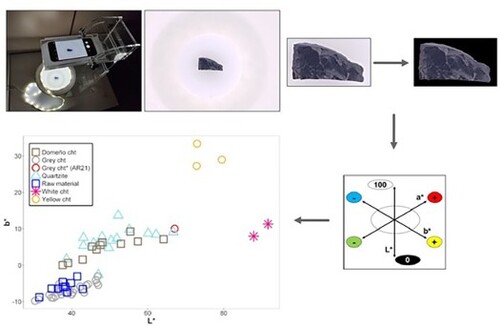
Figure 1. Localisation of La Calvera rock-shelter in the Iberian Peninsula.
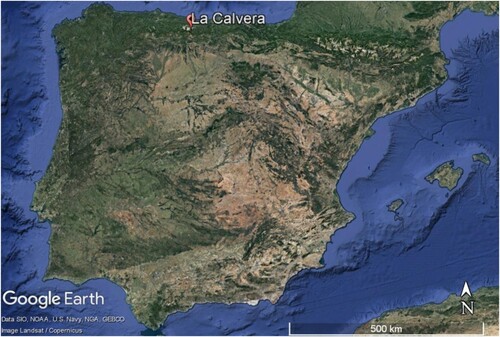
Figure 2. Picture of example sampled rocks: raw material chunk of dark grey chert (a: RM01), dark grey chert flakes (b: AR11; c: AR21), whitish chert (d: AR23), yellowish chert (e: AR38.2), quartzite (f: AR27), rock crystal (g: AR20) and Domeño chert fragment (h: AN01.2).
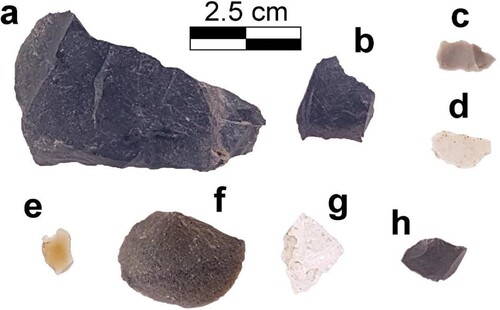
Figure 3. Flowchart for image analysis.
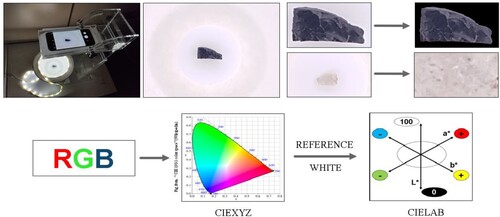
Table 1. Average values and standard deviations of CIELAB colour space parameters obtained by imaging of smartphone photos.
Table 2. Average values and standard deviations of CIELAB colour space parameters obtained by Vis-SP.
Figure 4. Results of colour analysis: (a) Heatmap of L*, a* and b* for AR03 (see for mean, µ, and standard deviation, σ); (b) comparison between colour analysis carried out by Vis-SP and imaging; (c) scatter plot for L* vs b* obtained by imaging of smartphone pictures.
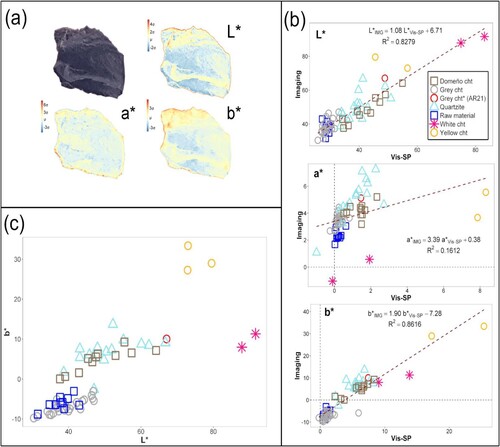
Figure 5. DRIFT (a) and Raman (b and c) spectra for the different types of samples. Spectra were scaled by standard normal variate (SNV) and they are offset to avoid overlapping.
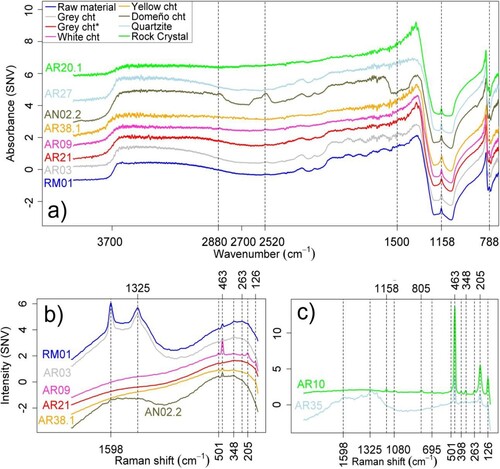
Figure 6. Samples/scores plot (a) and variables/loadings plots for PC1 (b) and PC2 (c).
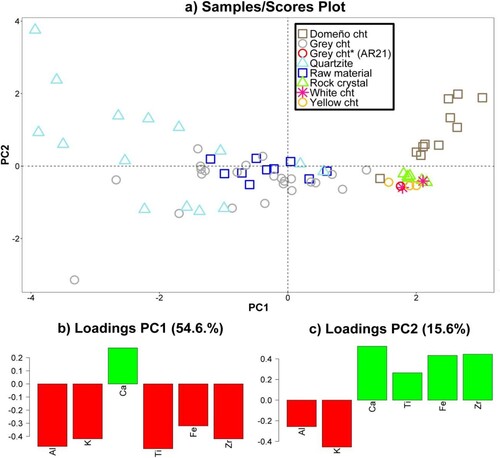
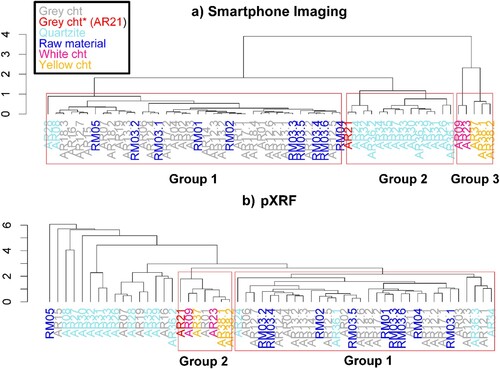
Figure 7. Cluster analysis of smartphone imaging (a) and pXRF (b) results.