
Figures & data
Figure 1. Flow-chart of patient’s recruitment (T-group and C-group)
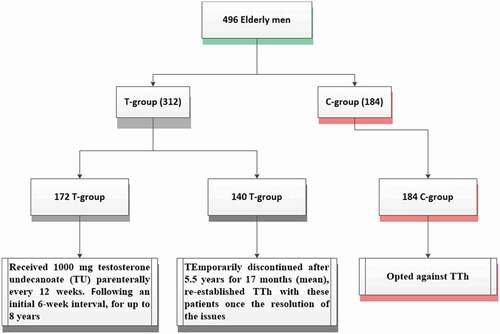
Table 1. Baseline characteristics of the T-group and C-group
Figure 2. The TT levels at baseline and over the 8-year period for the 312 hypogonadal men in the T-group and 184 untreated hypogonadal men in the C-group (*P < 0.001)
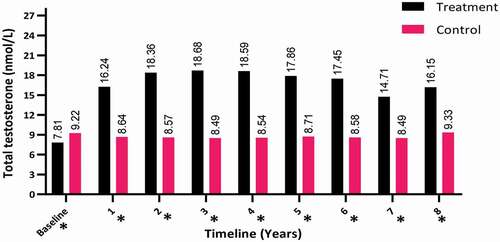
Figure 3. The FLI at baseline and over the 8-year period for the 312 hypogonadal men in the T-group and 184 untreated hypogonadal men in the C-group. *significant; N.S., not significant
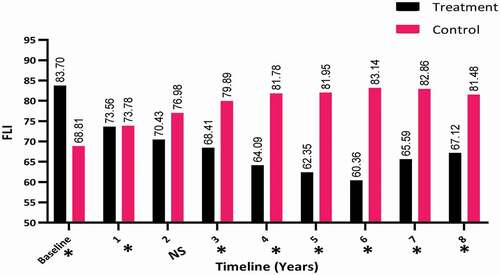
Figure 4. The γ-GT levels at baseline and over the 8-year period for the 312 hypogonadal men in the T-group and 184 untreated hypogonadal men in the C-group (*P < 0.001). N.S., not significant
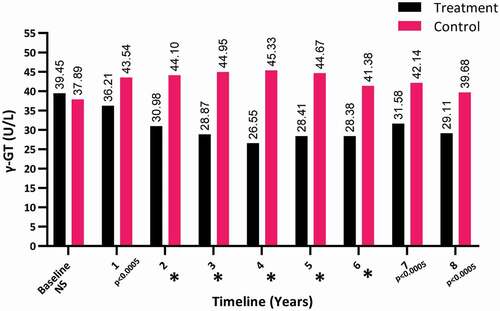
Figure 5. The bilirubin levels at baseline and over the 8-year period for the 312 hypogonadal men in the T-group and 184 untreated hypogonadal men in the C-group. N.S., not significant
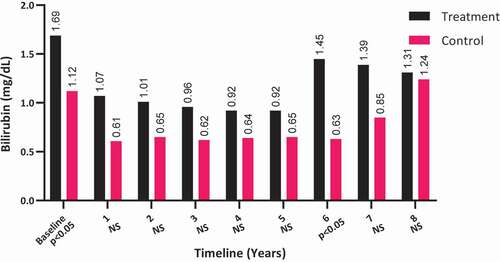
Figure 6. The AST levels at baseline and over the 8-year period for the 312 hypogonadal men in the T-group and 184 untreated hypogonadal men in the C-group (*P < 0.001). N.S., not significant
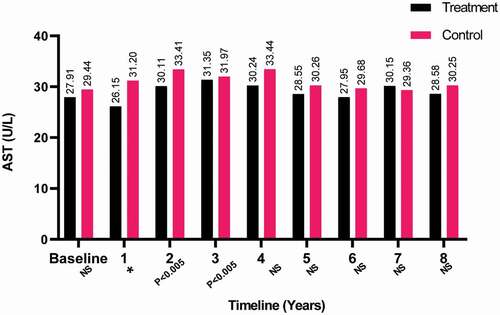
Figure 7. The ALT levels at baseline and over the 8-year period for the 312 hypogonadal men in the T-group and 184 untreated hypogonadal men in the C-group. N.S., not significant
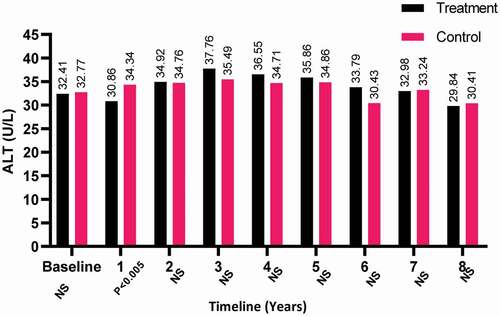
Figure 8. The triglyceride levels at baseline and over the 8-year period for the 312 hypogonadal men in the T-group and 184 untreated hypogonadal men in the C-group (*P < 0.001)
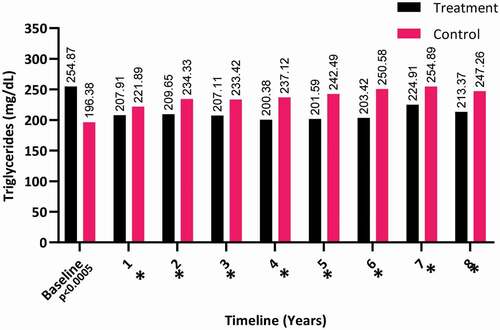
Figure 9. The BMI (kg/m2) at baseline and over the 8-year period for the 312 hypogonadal men in the T-group and 184 untreated hypogonadal men in the C-group (*P < 0.001)
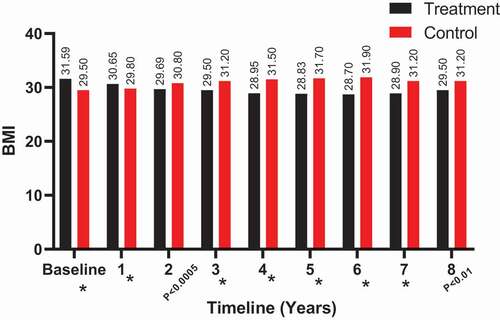
Figure 10. The WC at baseline and over the 8-year period for the 312 hypogonadal men in the T-group and 184 untreated hypogonadal men in the C-group (*P < 0.001)
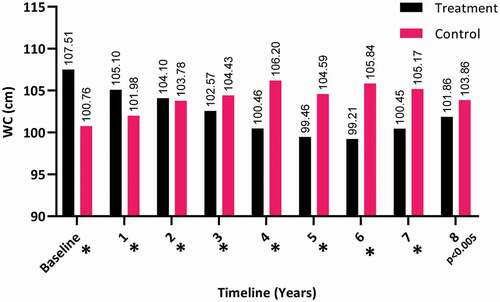
Table 2. Comparison of adverse events between the T-group following long-term treatment with TU and the C-group