Publication Cover
Mycology
An International Journal on Fungal Biology
Volume 3, 2012 - Issue 3
2,300
Views
0
CrossRef citations to date
0
Altmetric
Articles

Toxigenic Aspergillus flavus and other fungi of public health concern in food and organic matter in southwest Nigeria

, , &
Pages 210-219 | Received 30 Jun 2012, Accepted 14 Aug 2012, Published online: 06 Sep 2012

Figures & data

Table 1. Identification (ID) of sampled fungi based on morphology and ITS sequence analysis

Figure 1. Macromorphology images for each isolate using various media (top image), with corresponding micromorphology based on 40× magnification (bottom image). Images are shown in numerical order from SF1 (top left) to SF18 (bottom right).
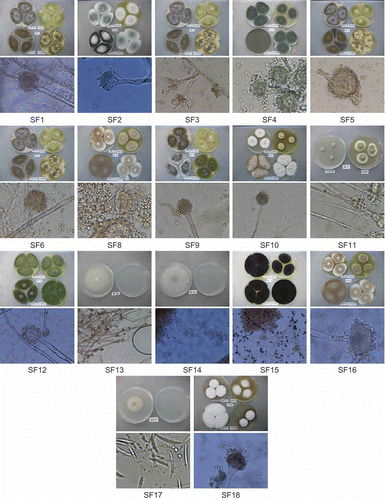
Figure 1. Macromorphology images for each isolate using various media (top image), with corresponding micromorphology based on 40× magnification (bottom image). Images are shown in numerical order from SF1 (top left) to SF18 (bottom right).

Table 2. Aflatoxin chemotype profiles for sampled Aspergillus flavus isolates

Figure 3. TLC plate showing the presence of CPA for each Aspergillus flavus isolate sampled. This is the same TLC plate as shown in , except that this plate has been sprayed with a mixture of 1% dimethyl-aminobenzaldehyde in ethanol, followed by sulphuric acid:ethanol (1:1), then drying the spray solution on the plate with a heat gun.
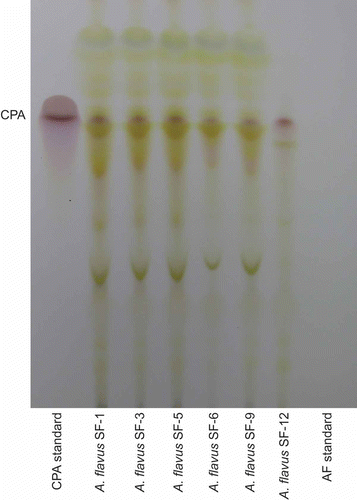
Figure 3. TLC plate showing the presence of CPA for each Aspergillus flavus isolate sampled. This is the same TLC plate as shown in Figure 2, except that this plate has been sprayed with a mixture of 1% dimethyl-aminobenzaldehyde in ethanol, followed by sulphuric acid:ethanol (1:1), then drying the spray solution on the plate with a heat gun.

Figure 2. TLC plate showing fluorescence of B and G aflatoxins under long-wave UV illumination (365 nm). The aflatoxin bands are noted on the right side of the image. These bands correspond to the AF standard lane noted at the bottom right of the image. The CPA standard, which does not fluoresce under UV, is noted on the bottom left lane. Between both standard lanes are the Aspergillus flavus isolates sampled.
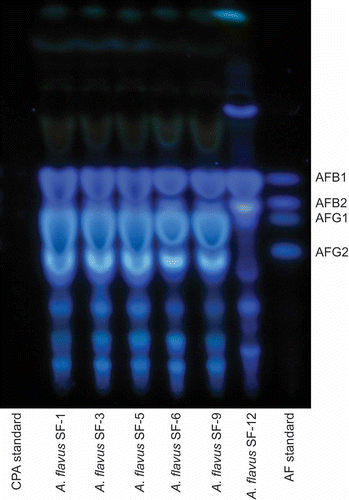
Figure 2. TLC plate showing fluorescence of B and G aflatoxins under long-wave UV illumination (365 nm). The aflatoxin bands are noted on the right side of the image. These bands correspond to the AF standard lane noted at the bottom right of the image. The CPA standard, which does not fluoresce under UV, is noted on the bottom left lane. Between both standard lanes are the Aspergillus flavus isolates sampled.

Table 3. GenBank accession numbers for ITS and aflF-aflU sequences

Reprints and Corporate Permissions

Please note: Selecting permissions does not provide access to the full text of the article, please see our help page How do I view content?

To request a reprint or corporate permissions for this article, please click on the relevant link below:

Academic Permissions

Please note: Selecting permissions does not provide access to the full text of the article, please see our help page How do I view content?

Obtain permissions instantly via Rightslink by clicking on the button below:

If you are unable to obtain permissions via Rightslink, please complete and submit this Permissions form. For more information, please visit our Permissions help page.