Figures & data
Figure 1. DENV suppressed megakaryopoiesis in vivo. The experimental outlines are indicated (A). C57BL/6J mice were retro-orbitally injected with DENV (0.6–1.2 × 10⁵ PFU/mouse). The peripheral blood cells were collected, and the platelet counts were monitored at 24 h before the experiment and at 24 and 48 h after the first injection (B). Saline-treated groups were used as controls. Flow cytometry analyses were performed on bone marrow cells at 48 h (C) after the first injection. High-FSC (cell size) and CD61+ cells were gated as the R1 region. PI staining revealed the cellular DNA contents. The percentage of cells in the R1 region (D) and the percentages of polyploid cells (DNA content ≥ 4 N) in the R1 region are illustrated (E). Data are reported as the mean ± standard deviation (SD) and represent 3–5 independent experiments. ## P < 0.01 compared with the saline-treated groups
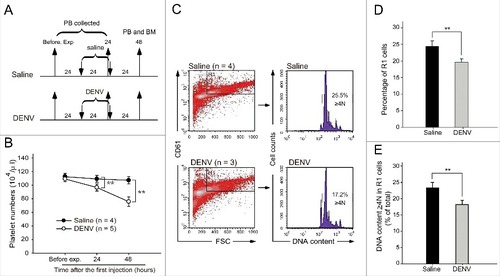
Figure 2. DENV-EIII suppressed megakaryopoiesis in vivo. The experimental outlines are indicated (A). C57BL/6J mice were retro-orbitally injected with DENV-EIII. Saline and recombinant GST protein were used as controls. The peripheral blood cells were collected and the platelet counts were monitored at 24 h before the experiment and at 24 and 48 h after the first injection (B). Flow cytometry analyses were performed on BM cells at 48 h (C) after the first injection. The percentage of cells in the R1 region (D) and the percentages of polyploid cells (DNA content ≥ 4 N) in R1 region are illustrated (E). Data are reported as the mean ± SD and represent 3–4 independent experiments. #P < 0.05, ##P < 0.01 compared with the indicated groups
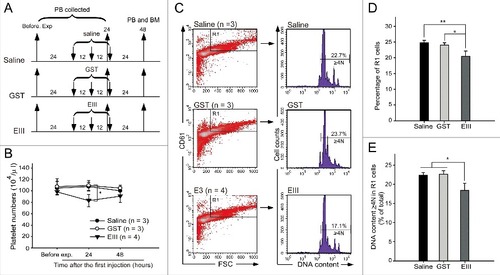
Figure 3. DENV-EIII killed differentiated MKs derived from mouse bone marrow. Murine bone marrow cells (erythrocyte-depleted fraction) were isolated and triggered to differentiate into MKs in the presence of mouse thrombopoietin. The GST protein was used as a control. DENV-EIII or GST protein was added on Day 0 and Day 3, and data were analyzed on Day 6 through flow cytometry (A). Cells were stained with CD41 antibodies, and CD41+ cells were gated to analyze DNA content through PI staining (B). The percentages of R1 cells among all analyzed cells (C), and the percentages of polyploid cells (DNA content ≥ 4N) and sub-G1 hypoploid cells in the R1 region are shown (D). Murine MKs were isolated from bone marrow, incubated with DENV-EIII proteins for 1 h, and stained with antibodies against DENV-EIII and CD61. IgG isolated from preimmunized rabbit serum served as control Ig (CIg). Cells were divided into 3 groups: anti-CD61 + anti-EIII, EIII + anti-CD61 + CIg, and EIII + anti-CD61 + anti-EIII. The percentages of CD61+/DENV-EIII+ double positive cells among the total cells and total CD61+ cells were analyzed (E) and quantified (F). Data are reported as the mean ± SD and represent 4 ((C)and D) and 3 (F) independent experiments. #P < 0.05, ##P < 0.01 compared with the GST-treated groups (C, D). ##P < 0.01 compared with the anti-CD61 + anti-EIII groups (F)
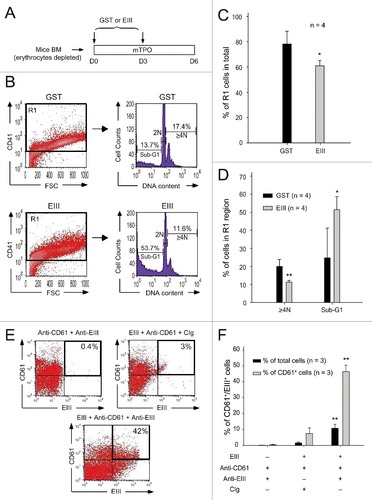
Figure 4. DENV-EIII suppressed megakaryopoiesis in the CFU-MK assay. Mononuclear cells isolated from human umbilical cord blood were used in the CFU-MK assay. The morphology (A–B) and quantitative numbers (C) of MK colonies after GST (A1–A3 and B1–B3) and DENV-EIII (A4–A6 and B4–B6) treatments are shown. Arrowheads indicating specific colonies in the low magnification images (A1–A6) are highlighted in the high magnification photographs (B1–B6). Scale bar: 2 mm (A), 200 μm (B). Data are presented as the mean ± SD and represent 4 independent experiments. ## P < 0.01 compared with the GST-treated groups
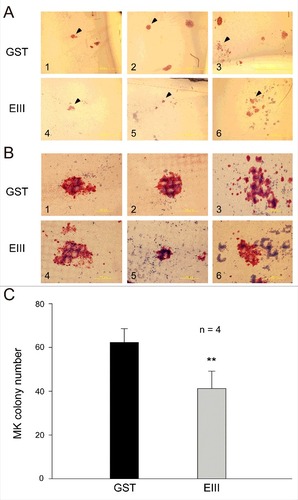
Figure 5. DENV-EIII suppressed cytokines-triggered megakaryopoiesis by killing differentiated cells in umbilical cord blood-derived CD34+ cells. A 16-day experiment on megakaryocytic differentiation was performed using expanded umbilical cord blood-derived CD34+ cells. DENV-EIII was added on Days 0, 4, 8, and 12, and flow cytometry data were analyzed on day 16 (A). The vehicle and GST protein were used as controls. The FSC and SSC are shown (B). The cell numbers in the R1 and R2 regions (C) and the percentages of CD61- and CD61/CD42b-expressing cells in the R2 region (D) are shown. PI staining revealed the cellular DNA contents, and the sub-G1 hypoploid cells were increased in the DENV-EIII-treated groups (E). Summarized events of (C), (D) and (E) are shown in (F) and (G), respectively. Data are reported as the mean ± SD and represent 3–5 independent experiments. # P < 0.05, ## P < 0.01 compared with the vehicle-treated groups
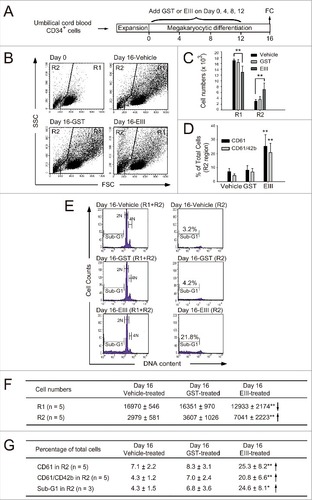
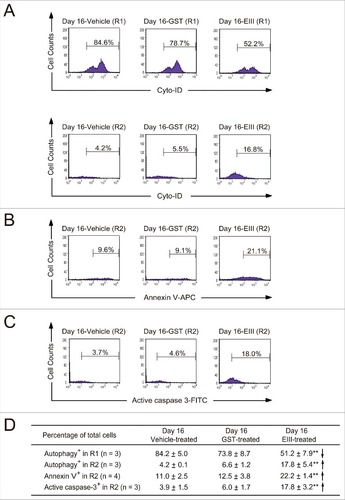
Figure 6. DENV-EIII killed differentiated MKs in umbilical cord blood–derived CD34+ cells through impaired autophagy and apoptosis. The 488-nm-excitable Cyto-ID green fluorescent reagents were used to monitor the autophagic cells in the R1 and R2 regions (A). Annexin V-allophycocyanin (B) and an antibody against activated caspase-3 conjugated with fluorescein isothiocyanate (C) were used to investigate the apoptotic changes in DENV-EIII-treated cells through flow cytometry. Summarized events are shown in (D). Data are reported as the mean ± SD and represent 3–4 independent experiments. ## P < 0.01 compared with the vehicle-treated groups