2,652
Views
39
CrossRef citations to date
0
Altmetric
Letter to the Editor

Galleria mellonella as a host model to study Candida glabrata virulence and antifungal efficacy

, , , , & ORCID Icon
Pages 1909-1917 | Received 22 Jun 2017, Accepted 23 Jun 2017, Published online: 01 Aug 2017

Figures & data

Figure 1. Virulence of C. glabrata in G. mellonella. (A and B) Survival curves of G. mellonella infected with C. glabrata ATCC2001 at 7.5 × 10⁵ (squares), 1 × 10⁶ (triangles), 2.5 × 10⁶ (upside-down triangles), 5 × 10⁶ (diamonds) and 7.5 × 10⁶ (circles) cells/larva at 37°C (A) and 30°C (B). At 37°C (A) all infective doses displayed significant differences (p < 0.05), whereas at 30°C (B) all doses displayed significant differences (p < 0.05) except between the 2 lowest infective doses (7.5 × 10⁵ and 1 × 10⁶ cells/larva). (C) Larvae were infected with C. glabrata ATCC2001 at 1 × 10⁶, 2.5 × 10⁶, and 5 × 10⁶ cells/larva and at 2 and 6 hours post infection hemolymph was collected from larvae and OD405 determined to quantify melanin production. Larvae inoculated with PBS were used as a control, and asterisks denote a statistically significant difference to the PBS control (p < 0.05). (D) G. mellonella were infected with C. glabrata ATCC2001 at 2.5 × 10⁶ cells/larva and fungal burdens determined at the time points indicated. Scatterplots depict combined results from 3 independent replicates using 9 larvae for each time point
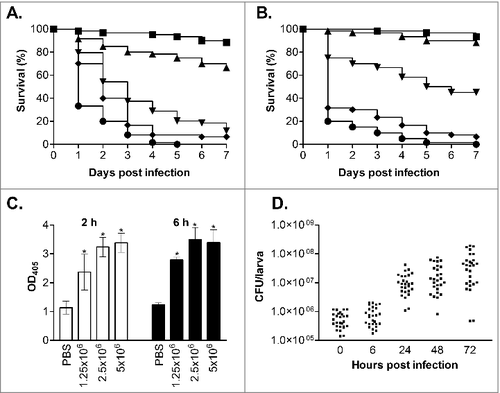
Figure 1. Virulence of C. glabrata in G. mellonella. (A and B) Survival curves of G. mellonella infected with C. glabrata ATCC2001 at 7.5 × 10⁵ (squares), 1 × 10⁶ (triangles), 2.5 × 10⁶ (upside-down triangles), 5 × 10⁶ (diamonds) and 7.5 × 10⁶ (circles) cells/larva at 37°C (A) and 30°C (B). At 37°C (A) all infective doses displayed significant differences (p < 0.05), whereas at 30°C (B) all doses displayed significant differences (p < 0.05) except between the 2 lowest infective doses (7.5 × 10⁵ and 1 × 10⁶ cells/larva). (C) Larvae were infected with C. glabrata ATCC2001 at 1 × 10⁶, 2.5 × 10⁶, and 5 × 10⁶ cells/larva and at 2 and 6 hours post infection hemolymph was collected from larvae and OD405 determined to quantify melanin production. Larvae inoculated with PBS were used as a control, and asterisks denote a statistically significant difference to the PBS control (p < 0.05). (D) G. mellonella were infected with C. glabrata ATCC2001 at 2.5 × 10⁶ cells/larva and fungal burdens determined at the time points indicated. Scatterplots depict combined results from 3 independent replicates using 9 larvae for each time point

Figure 2. Virulence of C. glabrata clinical isolates in G. mellonella. Survival curves of G. mellonella infected with C. glabrata ATCC2001 (open squares), NCPF3605 (closed squares), BG2 (triangles), Cg1184 (upside-down triangles), Cg85/038 (diamonds), and Cg11088A (circles) at 1 × 10⁶ (A), 2.5 × 10⁶ (B), and 5 × 10⁶ (C) cells/larva. At all doses strain NCPF3605 was highly attenuated compared with all other strains (p < 0.0001); plus at the highest dose (C) a slight but significant increase in virulence was seen for Cg1184 compared with BG2 (p < 0.005) and Cg11088A (p < 0.05)

Figure 2. Virulence of C. glabrata clinical isolates in G. mellonella. Survival curves of G. mellonella infected with C. glabrata ATCC2001 (open squares), NCPF3605 (closed squares), BG2 (triangles), Cg1184 (upside-down triangles), Cg85/038 (diamonds), and Cg11088A (circles) at 1 × 10⁶ (A), 2.5 × 10⁶ (B), and 5 × 10⁶ (C) cells/larva. At all doses strain NCPF3605 was highly attenuated compared with all other strains (p < 0.0001); plus at the highest dose (C) a slight but significant increase in virulence was seen for Cg1184 compared with BG2 (p < 0.005) and Cg11088A (p < 0.05)

Table 1. Virulence of C. glabrata mutants in the G. mellonella model

Figure 3. Antifungal efficacy against C. albicans and C. glabrata in the G. mellonella model. Survival curves of G. mellonella infected with 1 × 10⁵ cells/larva C. albicans NGY152 (A, C and E), or 1.25 × 10⁶ cells/larva C. glabrata ATCC2001 (B, D and F). (A and B) Fluconazole treatment at 0 (squares), 3 (triangle), 6 (diamonds) or 12 mg/kg (circles). (C, D, E and F) Amphotericin B or Caspofungin treatment at 0 (squares), 1 (triangle), 2 (diamonds) or 4 mg/kg (circles)
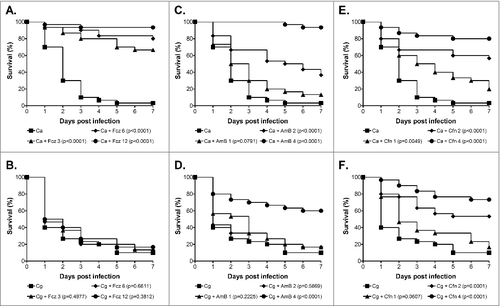
Figure 3. Antifungal efficacy against C. albicans and C. glabrata in the G. mellonella model. Survival curves of G. mellonella infected with 1 × 10⁵ cells/larva C. albicans NGY152 (A, C and E), or 1.25 × 10⁶ cells/larva C. glabrata ATCC2001 (B, D and F). (A and B) Fluconazole treatment at 0 (squares), 3 (triangle), 6 (diamonds) or 12 mg/kg (circles). (C, D, E and F) Amphotericin B or Caspofungin treatment at 0 (squares), 1 (triangle), 2 (diamonds) or 4 mg/kg (circles)