
Figures & data
Figure 1. T. marneffei aspartyl protease encoding gene expansion.
A neighbor-joining relatedness tree of genes in the pop expansion as well as pepA orthologues in other Eurotiomycetidae species. Branch confidence values are bootstrap supports from 1000 pseudoreplicates. T. marneffei pepB is included as an outgroup. The grey shading denotes expanded pop clade in T. marneffei. The dashed line denotes shortened branch lengths. The arrowhead indicates the position of a predicted retrotransposition event. Species abbreviations are as follows: Ts, Talaromyces stipitatus; Tc, Talaromyces cellulolyticus; Tv, Talaromyces verruculosus; Te, Trichophyton equinum; Tt, Trichophyton tonsurans; An, Aspergillus nidulans; Pc, Penicillium chrysogenum; Af, Aspergillus fumigatus; Nf, Neosartorya fischeri; Ac, Aspergillus clavatus; At, Aspergillus terreus; Ao, Aspergillus oryzae; Aa, Aspergillus avus; Ur, Uncinocarpus reesei; Hc, Histoplasma capsulatum; Bd, Blastomyces dermatitidis.
Figure 2. Aspartyl protease-encoding genes vary in copy number between strains.
The copy number of pepA and the pop genes in 20 strains of T. marneffei relative to the reference genome of FRR2161 is depicted. For each gene, the estimated copy number (vertical axis) in each strain (horizontal axis) is shown. Estimated copy number is based on read depth over each gene in each strain. The popP gene is an example of a gene with no copy number variation.
Figure 3. Both positive and negative selection is evident amongst the aspartyl protease-encoding genes.
A heatmap showing the normalized non-synonymous/synonymous selection test statistic in pairwise comparison between all pop genes and pepA Talaromycete orthologues. The axes show the gene identifier (as a one letter abbreviation) for each T. marneffei pop gene or the species for each pepA gene (Tm, T. marneffei; Ts, T. stipitatus; Tc, T. cellulolyticus; Tv, T. verruculosus). Negative values suggest purifying selection is operating while positive values indicate relaxed selection.
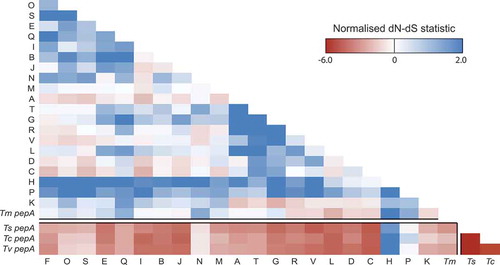
Table 1. Transposons and repetitive elements in 10kb region surrounding the pop genes.
Figure 4. High prevalence of repetitive sequences flanking the aspartyl protease-encoding genes.
The prevalence of repetitive sequences in the upstream and downstream 10kb regions flanking pepA and pop genes is depicted. The red bar denotes each gene locus while the repetitiveness of flanking regions is shown by blue bars. A log scale of 1 to 100 indicates repetitiveness scores for the flanking regions. For example, a score of 5 at a given position indicated that the 30mer at that position is found in five other locations in the genome. The Y-axis is logarithmic. The popA gene is offset from the center due to its proximity to the end of a genome assembly scaffold. Repetitiveness of zero is due to unknown sequences in the incomplete scaffold assembly. The popS gene is an example of a gene with no repetitive flanking sequences.
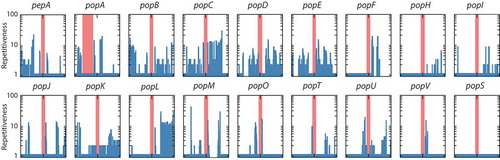
Figure 5. Aspartyl protease genes show specific, differential expression patterns.
Gene expression profiles for the pepA and pop genes during in vitro and ex vivo growth are shown based on RPKM. The in vitro conditions were vegetative growth in the hyphal form at 25 ̊C and yeast form at 37 ̊C in BHI medium after four and six days, respectively. The ex vivo conditions were growth in the yeast form inside murine J774 and human THP-1 macrophages for 24-h. The pie charts depict a proportional representation of the expression under each condition for each gene. Dashed line denotes a change in the y-axis scale.
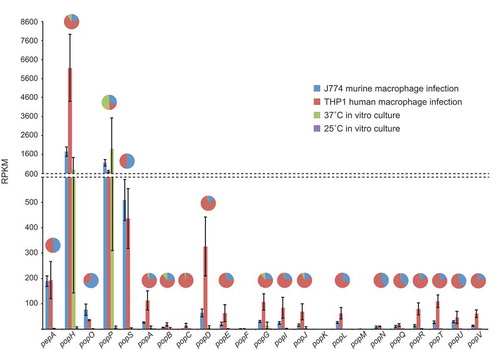
Table 2. Germination of pop mutants and complemented strains.
Figure 6. Aspartyl protease-encoding genes are required for appropriate morphogenesis inside host macrophages.
(a) Strains bearing mutations in the pop genes showing yeast cell-specific expression were used to infect murine J774 macrophages and assayed for yeast cell morphogenesis after 24-h post infection. The popP, popO and popS single deletion mutant strains show decreased yeast cell formation in macrophages compared to the wild-type. Double deletion mutant strain combinations for these genes show varying levels of reduction in yeast cell formation with popS combinations showing the greatest change. Representative images using DIC and epifluorescence (CAL, calcofluor staining) are shown. Arrows highlight spores that failed to produce yeast cells. Scale bars = 10 µm. (b) Conversion of dormant conidia into yeast cells (germination) inside J774 macrophages was quantified for each of the mutant strains. Approximately 100 infected J774 macrophage cells infected with each strain in three biological repeat experiments were used to determine germination, and then plotted as a percentage of the wild-type levels. The error bars represent SEM with t-test values falling in the following range * = <0.05, ** = <0.01, *** = <0.001. (c) A model of the postulated genetic interaction pathway based on the severity of their phenotypes and non-additive, epistatic interactions noted for the various combinations of gene deletions and the single mutants. The dotted arrow and question mark denote possible unidentified pathways or proteases of the pop family that may contribute to the formation of yeast cells in T. marneffei during intracellular growth.
Figure 7. Yeast-specific aspartyl proteases show distinct cellular localization.
Full length, C-terminal fusions of the yeast-specific pepA and pop genes were created with mCherry and introduced into the respective deletion strains. (a) During in vitro growth of yeast cells at 37°C on BHI medium for 6 days, clear mCherry-based fluorescence was evident for the popP and popH fusions only and showed both vesicular and septal localisation (arrowheads). Representative images using DIC and epifluorescence are shown. Scale bar = 10 μm. (b) During growth inside J774 macrophages at 24 hours post-infection, immunofluorescence microscopy using antibodies to mCherry shows that the Pop::mCherry fusion proteins are localised as puncta, often, but not exclusively, perinuclear while the PepA::mCherry fusion protein shows clear cell membrane and/or cell wall localisation. Representative images of cells under DIC and after staining with calcofluor (cell walls) and anti-mCherry antibody (fusions) using epifluorescence are shown. Scale bar = 10 μm.
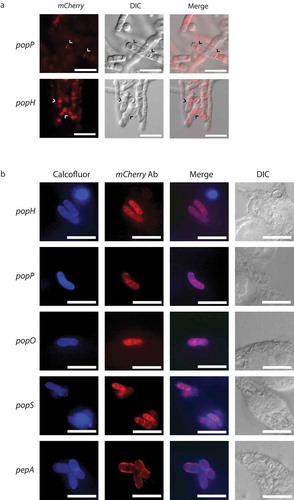
Table 3. Germination of pop mutants and wild-type in single and co-infection conditions.