
Figures & data
Figure 1. C. auris is highly resistant to various stressors in vitro. Drop tests with serial dilutions of C. auris and the clinically most relevant Candida species were performed under various stress conditions to analyze fungal (a) tolerance of oxidative stress, (b) resistance against UV light and high temperature, and (c) resistance against osmotic stress. The highest concentration (left) was 1 × 10⁸ fungal cells/ml. Pictures were taken after 1–2 days of incubation at the indicated temperature and representative examples from at least two biological replicates are shown.
Figure 2. C. auris survives long periods under nutrient-limited, environmental conditions. (a) Survival of Candida spp. in water at 30°C over a time period of 24 days was analyzed by CFU quantification at indicated time points. Results are shown relative to day 0 as 100%. n ≥ 3, mean ± SD; ** p ≤ 0.005, *** p ≤ 0.001 vs. C. auris (b) Candida survival in water over 24 days from (a) is expressed as Area Under Curve (AUC), clearly indicating differences between Candida species. n ≥ 3 (c) Survival of Candida spp. after a dry period of 0, 3, 6 or 12 days was assessed by analyzing re-growth in YPD at 30°C by optical density (OD) measurement at 600 nm over 48 h. n ≥ 3 shown as mean.
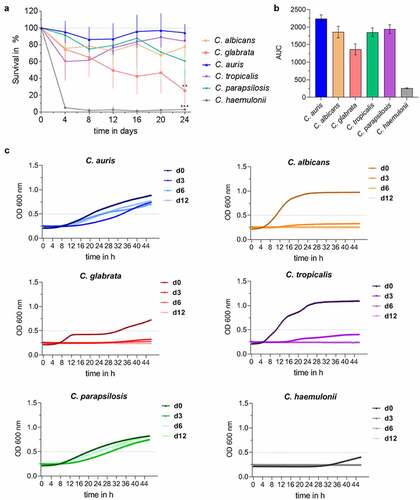
Figure 3. C. auris interacts with immune cells and is efficiently killed during ex vivo whole blood infection. (a) Survival of C. auris, C. albicans, and C. glabrata in human whole blood was determined 30, 60, 120, and 240 minutes post infection (mpi) by CFU quantification relative to time point 0 mpi as 100%. n = 6, mean ± SD (b) Exemplary microscopic pictures of blood smears prepared at indicated time points from C. auris infected whole blood. Arrows indicate fungal and human immune cells. 100 x magnification (c) Association of fungal cells with immune cells was determined by fluorescence activated cell sorting (FACS) analyses at 60 mpi and 240 mpi. n = 3, mean ± SD for independent experiments using different donors.
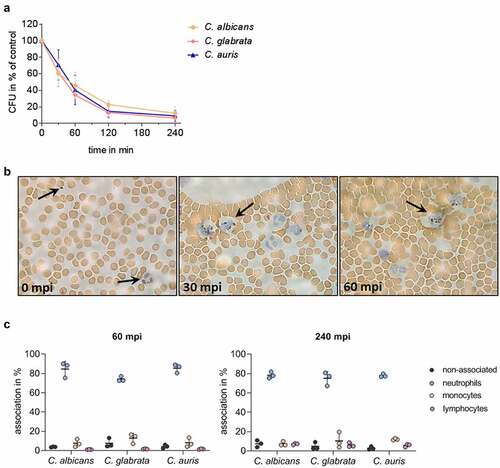
Figure 4. The human transcriptional response to C. auris in whole blood infection resembles the response to other Candida species. (a) Principal Component analysis (PCA plot) of the human transcriptome based on MRN values. Different time points (color) and Candida species (icon) are indicated to show similarity (b) Transcriptional kinetics shown by the number of human up- and down-regulated genes at different time points during C. auris infection (compared to 0 min) (c) Venn diagram for Homo sapiens comparing differentially expressed genes (DEGs) of each time point (compared to 0 min) during C. auris infection. (d) Venn diagram for infection with each indicated Candida species comparing human DEGs from infection with the indicated Candida species, considering genes differentially expressed during at least one time point.
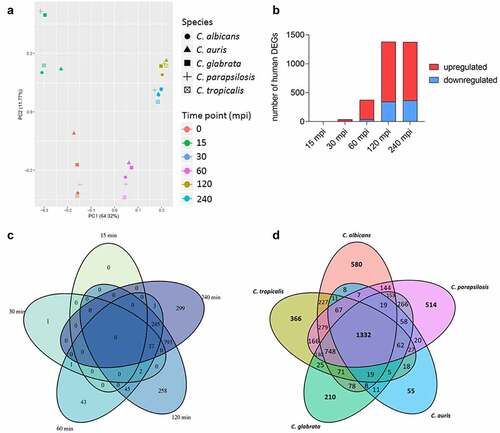
Figure 5. The transcriptional response of blood cells to C. auris is dominated by the expression of immune mediators. (a) Expression of human genes encoding immune cell receptors, cytokines or chemokines, or associated with immune cell signaling or effector functions. Gene expression is shown color-coded as log2FC vs. 0 min and for each time point (15, 30, 60, 120, 240 mpi). More details are given in Table S3. (b) Plasma levels of the pro-inflammatory cytokines IL-1β, IL-6, TNF-α and the chemokine IL-8 240 mpi with C. auris alive or heat-killed (HK) or in an uninfected control sample. n ≥ 5 different donors shown as mean ± SD (c) Expression of selected human cytokines over the time course of C. auris infection. Gene expression is shown as log2FC vs. 0 min, indicated by color intensity.
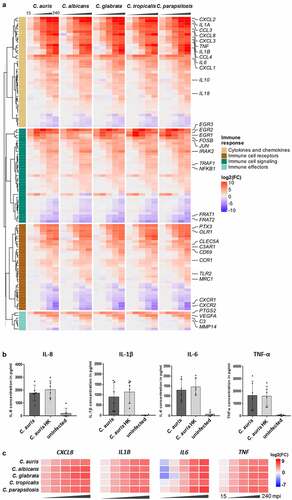
Figure 6. Species-specific gene expression of C. auris during whole blood infection. (a) The transcriptional changes during whole blood infection are shown as % of the genome for each Candida species at the indicated time points. The total number of predicted open reading frames (ORF) is given in brackets for each species (b) Transcriptional kinetics shown by the number of up- and down-regulated C. auris genes at different time points during whole blood infection (compared to 0 min). (c) Venn diagram for C. auris comparing fungal differentially expressed genes (DEGs) of each time point (compared to 0 min) during whole blood infection. (d) Venn diagram comparing fungal DEGs for each indicated Candida species over the time course of whole blood infection, considering gene orthology and differential expression for at least one time point.
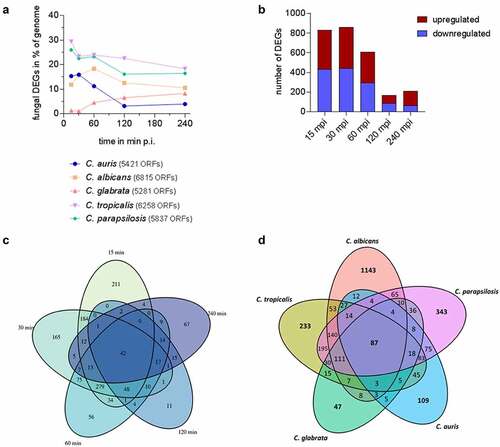
Figure 7. A pattern of its own: C. auris specific transcriptional alterations in response to human blood. Expression of selected fungal genes over the course of infection (15, 30, 60, 120, 240 mpi) with the indicated Candida species, associated with (a) protein folding, translation, the cell wall, oxidative stress or related to transport across the membrane, metal homeostasis, adhesion, or (b) metabolism. Gene expression is shown for orthologous genes color-coded as log2FC vs. 0 min for each time point. Genes without orthologues (or best hit according to BLASTP) are shown in gray. More details are given in Table S6.
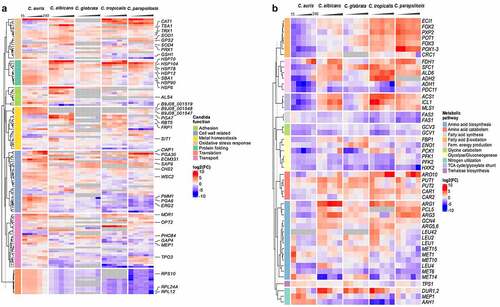
Figure 8. Human neutrophils recognize C. auris in vitro and respond with oxidative burst. (a) Human neutrophils were infected with different Candida strains at an MOI of 5. Phorbol 12-myristate 13-acetate (PMA) was used as a positive control. Results are shown as Area Under Curve (AUC) based on the ROS measurement presented in (b) n = 8, mean ± SD (B) ROS measurement over the course of co-incubation of different Candida strains with human neutrophils in vitro. MOI 5; n = 8; *** p ≤ 0.001 vs. C. auris (c) Human neutrophils were treated with PMA and in parallel infected with the indicated Candida spp. at an MOI of 10 to detect fungal ROS detoxification. Results are shown as AUC of the ROS measurement. n ≥ 7; *** p ≤ 0.001 vs. PMA.
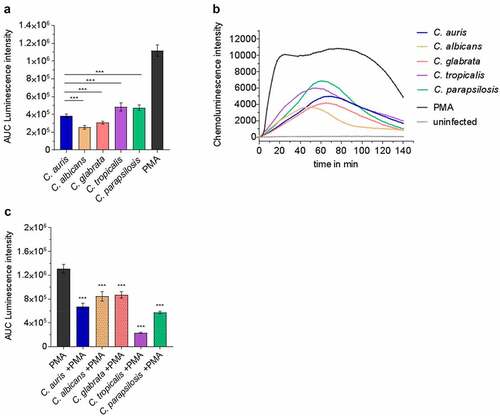
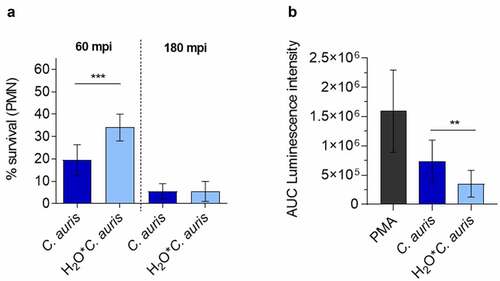
Figure 9. C. auris survival of neutrophil infection. (a) Survival of C. auris after 60 min or 180 min co-incubation with human neutrophils in vitro, determined by CFU quantification. n = 6, mean ± SD; *** p≤ 0.001 (b) Induction of ROS in human neutrophils after co-incubation with C. auris compared to C. auris pre-starved in water (H2O*C. auris) over 6 days. n = 6, mean ± SD; ** p≤ 0.005 .
Supplemental Material
Download Zip (4 MB)Data availability statement
The RNA-Seq data that support the findings of this study are openly available in NCBI’s Gene Expression Omnibus under the GEO record GSE179000and GSE114180. https://www.ncbi.nlm.nih.gov/geo/