Figures & data
Figure 1. Maximum-likelihood tree based on 18S rRNA gene sequences of 55 algal species, including five isolated strains in this study. The tree is rooted with Cyanobacteria from genus Cyanophora. Algal strains isolated in this study are indicated with red color.
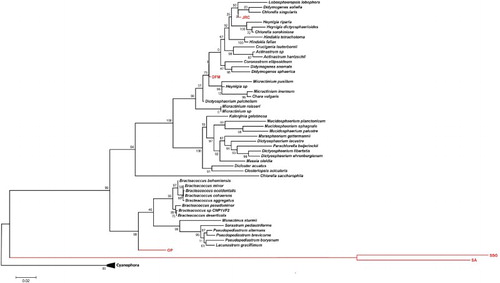
Figure 2. Effect of pH on growth of the microalgae. The OP (A), DFM (B), JRC (C), SSG and SA (D) strains for pH optimization (ranging from 6 to 9) in BBM growth media. The samples were taken after 7 days of inoculation to check the absorbance using spectrophotometer (Hitachi 2800). Growth conditions were: temperature 25°C, light intensity ∼50 Lumens cm−2, day/night period 1:1 and manual agitation. Experiment was performed in triplicates and GraphPad Prism Software was used to analyze recorded data. The points indicate average value of three independent experiments.
Figure 3. Growth curves of OP, DFM and JRC using BBM and BG11 as growth media (supplemented with vitamins and without vitamins). Experiments were performed in triplicates, and recorded data were analyzed by GraphPad Prism Software. Every point on the graph is showing average value of three independent experiments.
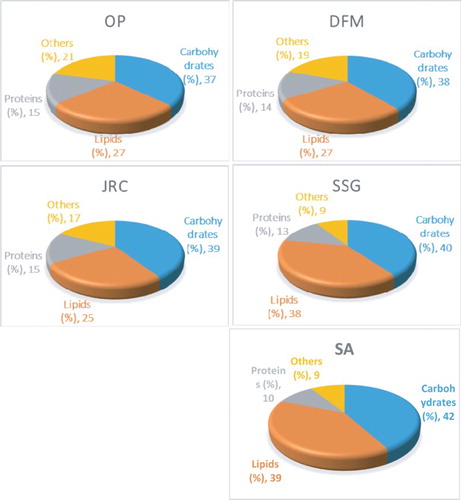
Figure 4. Characterization of algal biomass. Total protein, lipid and carbohydrate contents were analyzed as described in Materials and Methods section. Data shown are the average values of three independent experiments.