Figures & data
Figure 1. Adipose tissue stroma contains bone marrow-derived cells with adipogenic capacity. Adipose tissue stromal cells from the gonadal and dorsal interscapular adipose depots were recovered from female wild type mice transplanted with bone marrow from male donor mice ubiquitously expressing GFP (cells from n = 3–5 animals pooled/experiment; independent experiments conducted in triplicate). The stromal cells were stained with fluorescent antibodies to CD45, CD11b, Sca-1 and integrin β1 and separated by flow cytometry using the gating strategy, which progresses from left to right (blue arrows). A) Debris was excluded based on the ratio of forward scatter (FSC) height to side scatter (SSC) height. B) Clusters and aggregates were excluded based on the ratio of SSC height to FSC width. C) Comparison of SSC to GFP fluorescence revealed GFPDIM and GFPBright populations as well as GFP-negative cells. D) The majority of GFPDIM cells did not express CD45 or CD11b, but E) did express Sca-1 and integrin β1. F) Flow cytometry purified adipose stromal GFPDIM cells were plated on plastic in MesenCult medium with Stem Cell Stimulatory Supplements (SCSS) until they reached confluency. The medium was switched to MesenCult medium plus adipogenic supplements, and the cells were stained with Oil Red O after 9 d. Representative image shows Oil Red O stained lipid droplets indicating adipogenic differentiation. Magnification 10x. G) Flow cytometry of circulating peripheral blood mononuclear cells (PBMCs) from wild type mice transplanted with GFPPOS bone marrow reveals primarily GFPBright cells with a small number of GFPNEG cells. No GFPDIM cells were observed. Representative image of n = 5 independent animals. H) Flow cytometry of adipose stromal cells from untransplanted mice revealed only GFPNEG cells. I) Adipose stromal cells from mice transplanted with GFP-expressing BM were depleted of LinPOS cells by magnetic bead lineage depletion. Flow cytometry shows loss of GFPBright cells. Representative image of n = 3 independent animals.

Figure 2. GFPDIM adipose stromal cells have adipogenic capacity in vivo. GFPDIM and GFPNEG adipose stromal cells were purified from female wild type mice transplanted with BM from male mice constitutively expressing GFP by flow cytometric sorting as in (cells from n = 3–5 animals pooled/experiment). The cells were pelleted and resuspended in cold Matrigel at 2 × 10⁶ cells per 200 µl. The cell suspensions were injected subcutaneously in the abdomen anterior to the thigh of athymic female mice. Four weeks later the Matrigel plugs and adjacent skin and muscle were recovered, fixed in paraformaldehyde overnight and cut in half for embedding in paraffin. A) Five μm sections were deparaffinized and stained with Hematoxylin and Eosin. Figure shows images taken at 4x, 10x or 20x magnification of sections from mice receiving GFPNEG or GFPDIM cells. B) Additional sections were stained with a primary antibody to perilipin and Alexa 555-conjugated secondary antibody, and counterstained with DAPI. Fluorescence images taken at 40x show GFP and perilipin signals individually or overlaid with DAPI. Representative images of n = 3 independent experiments.
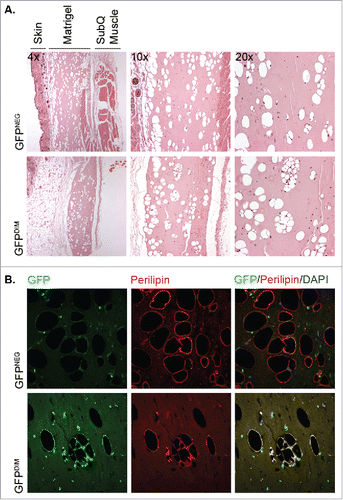
Figure 3. Adipose tissue macrophages are capable of adipogenic differentiation following culture in 3 dimensional fibrin matrices. A) Stromal cells from collagenase-digested gonadal adipose tissue of male mice (n = 3 pooled; independent experiments conducted in duplicate) were separated from adipocytes by centrifugation. Stromal cells were stained with fluorescent antibodies to CD64, CD11b, CD206, CD11c, Siglec-F and Gr-1, and myeloid subpopulations (macrophages, eosinophils, neutrophils and dendritic cells) were purified by flow cytometry using the gating strategy shown. Debris was excluded based on the ratio of FSC height to SSC height. Clusters and aggregates were excluded based on the ratio of SSC height to FSC width. CD64 fluorescence revealed distinct positive and negative populations. The CD64POS fraction expressed CD11b and CD206, but were negative for eosinophil (Siglec-F) and neutrophil (Gr-1) markers, and were recovered as the adipose tissue macrophage (Mac) population. The CD64NEG fraction contained cells expressing CD11b, but not CD206, and neutrophils (Neut, Gr-1POS) and eosinophils (Eos, Siglec-FPOS) were recovered from this population. Finally, the CD64NEG/CD11bNEG/CD206NEG fraction contained a CD11c-expressing population, which was recovered as dendritic cells (DC). DCs were not detected in stromal fractions stained with all antibodies minus the CD11c antibody (fluorescence minus one or FMO, inset). Each fraction was cultured in fibrin matrices overlaid with MesenCult medium containing SCSS for 5 d. B) Cells were recovered from the clots by plasmin hydrolysis of the fibrin and plated in plastic wells with MesenCult medium with SCSS until confluency. The cells were then switched to MesenCult medium with adipogenic supplements for 14–21 d. Cells were then stained with Oil Red O to assess adipogenic differentiation.
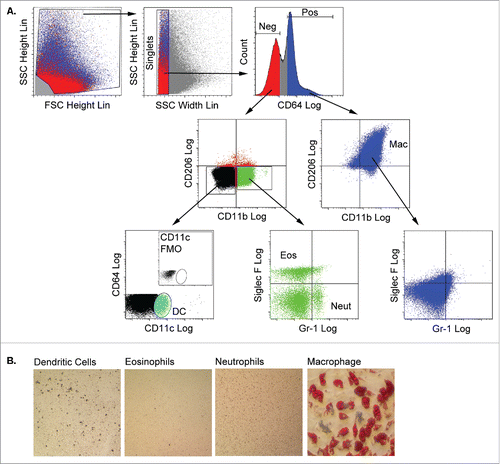
Figure 4. Adipose tissue myeloid cells lose expression of hematopoietic/myeloid markers, acquire mesenchymal and progenitor markers, and are capable of differentiating to multiple mesenchymal fates following 3D fibrin culture. (A & B) Pre-fibrin LinPOS gonadal and dorsal (pooled n = 3–5) adipose stromal cells (A) or post-fibrin “myeloid” cells (B) were stained with fluorescently-labeled antibodies to CD45, CD11b, integrin β1, PDGFRα and Sca-1 as indicated. Cells were analyzed and separated by flow cytometry. A) Pre-fibrin stroma contained cells expressing both CD45 and CD11b, but lacking integrin β1, PDGFRα and Sca-1. B) The majority of the post-fibrin cells were CD45NEG and CD11bNEG, but expressed integrin β1, PDGFRα and Sca-1. C) The CD45NEG/CD11bNEG post-fibrin cells were plated in plastic wells with MesenCult medium with SCSS until confluency. The cells were then switched to MesenCult medium with adipogenic supplements, or STEMPRO medium containing either osteogenic or chondrogenic supplements for 14–21 d. Cells were then stained with Oil Red O, Alcian Blue or Alizarin Red to assess adipogenic, chondrogenic or osteogenic differentiation, respectively. Analyses were performed twice independently. D) Semiquantitative RT-PCR for perilipin, adiponectin or GAPDH RNA extracted from post-fibrin CD45NEG/CD11bNEG cells treated with adipogenic agents as in (C). RNA from whole gonadal adipose tissue was included as a positive control. E) Post-fibrin CD45NEG/CD11bNEG cells were suspended in cold Matrigel and injected subcutaneously into female athymic mice (n = 2). After 4 weeks, the Matrigel plugs and adjacent tissue were recovered for fixation, embedding and sectioning. Five μm sections were stained with hematoxylin and eosin. Representative images show the presence of cavities in the Matrigel formed by adipocyte lipid droplets. F) Filaments of multinucleated cells spontaneously formed in cultures of post-fibrin CD45NEG/CD11bNEG cells in MesenCult medium as shown by DAPI staining. When stained with primary antibodies to either actinin or desmin and Alexa 555-conjugated secondary antibodies, the filaments exhibited intense fluorescence indicative of myocyte differentiation.
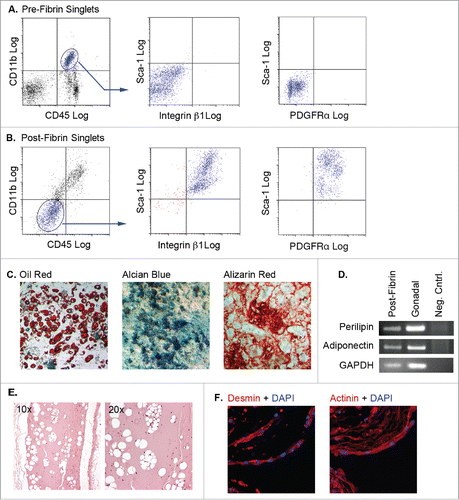
Figure 5. Myeloid cells from other tissues are incapable of complete mesenchymal differentiation after fibrin culture. Myeloid (CD45POS/CD11bPOS) cells were purified from the circulation (A, B & C), bone marrow (BM) and peritoneal fluid, (D), liver and lung (E, F & G), and B and T lymphocytes (H). Cells from n = 3 male and female animals were pooled experimented; independent experiments conducted in duplicate. The cells were cultured in fibrin clots for 5 days, recovered by plasmin hydrolysis of the clots and plated on plastic surfaces in MesenCult medium with SCSS. A) Flow analysis of pre-fibrin circulating myeloid cells. B) Flow cytometry analysis of post-fibrin “myeloid” cells. C) Post fibrin circulating cells or D) BM or peritoneal cells exhibited minimal plastic adherence and failed to proliferate. Flow cytometry analysis of E) pre-fibrin or F) post-fibrin liver “myeloid” cells. G) Post-fibrin cells from liver or lung were plastic adherent and proliferated. At confluence they were exposed to adipogenic, chondrogenic or osteogenic conditions for 14–21 d and stained with Oil Red O, Alcian Blue or Alizarin Red to assess adipogenesis, chondrogenesis or osteogenesis, respectively. H) Post-fibrin lymphocytes exhibited limited plastic adherence and failed to proliferate in SCSS medium. All images 20x magnification.
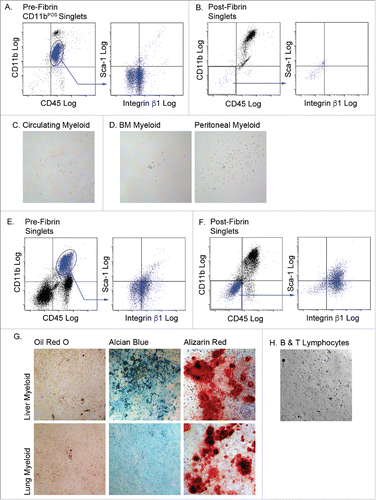
Figure 6. Blockade of integrin β1 expression prevents transition of adipose myeloid cells to “mesenchymal” progenitor cells. Adipose myeloid cells (pooled adipose tissue stroma, n = 7 independent donors) were treated with scrambled (Scrm) or integrin β1-specific siRNA 24 hours before culture in fibrin. A) Following transfection, cells were cultured in fibrin clots for 0, 3, 6 or 9 d and then recovered for RNA isolation and subsequent qRT-PCR analysis. RNA samples were run in triplicate and are presented as mean fold change ± SE as compared with day 0 scrambled control. B) Following transfection, cells were cultured 5 d in fibrin, recovered from clots and cultured on plastic for differentiation. Cells treated with scrambled siRNA acquired adipogenic capacity as shown by Oil Red O staining of lipid droplets. Cells treated with integrin β1-specific siRNA failed to adhere to plastic or proliferate following culture in fibrin clots.
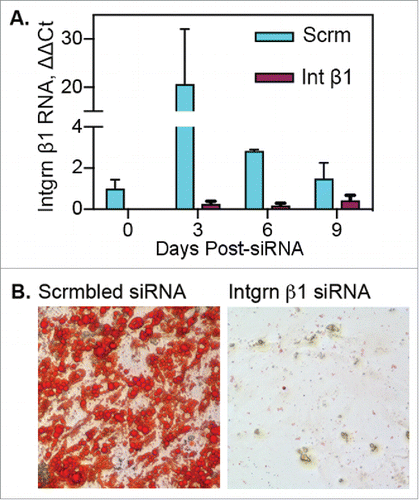
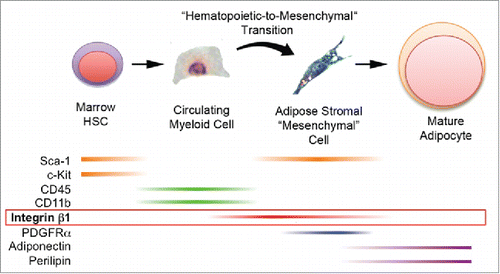
Figure 7. Production of bona fide adipocytes from bone marrow-derived hematopoietic progenitor cells via a hematopoietic-to-mesenchymal transition. Current and previous results support the production of adipocytes from bone marrow hematopoietic stem cells that express Sca-1 and c-Kit. These cells or their progeny enter the circulation as myeloid cells that express CD45 and CD11b (but now lack Sca-1 and c-Kit) and travel to adipose tissue. There they undergo a hematopoietic-to-mesenchymal transition during which they lose CD45 and CD11b and acquire integrin β1, Sca-1 and PDGFRα. Terminal adipogenesis is accompanied by loss of integrin β1, Sca-1 and PDGFRα and expression of mature adipocyte markers including adiponectin and perilipin 1.