Figures & data
Table 1. Baseline Characteristics.
Table 2. Basal and maximal ISO- mediated lipolytic response in SCAT adipocytes before and after intervention, compared to placebo.
Figure 1. Dose-response curves for ISO-mediated lipolytic response in human mature adipocytes derived from the SCAT before and after intervention. Lipolysis (glycerol release in the medium) is expressed compared to baseline, following incubation with increasing concentrations ISO (10−10 to 10−4 mol/l) before (circles) and after (triangles) 7 d treatment with placebo (panel A), AMOX (B) or VANCO (C), n = 22.
Figure 2. Gene expression profiling of lipolysis-related genes in adipose tissue before and after intervention, compared to placebo. This heat map depicts fold changes (FC) observed after compared to before AMOX (A), VANCO (V) and PLA (P) intervention. Data are derived from n = 15 individuals.
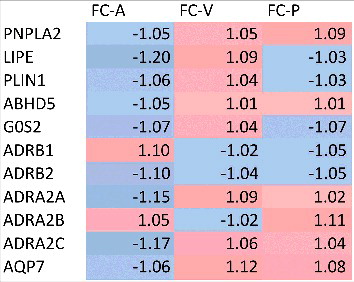
Figure 3. Quantitative analysis of the Western blots of HSL (A), ATGL (B) and phosphorylated HSL on Ser563 (corresponding to human Ser552) (C). Pre (white bars) and post (black bars) intervention data are normalized for the loading control β-actin. Values are given as mean ± SEM (n = 5 for PLA, n = 5 for VANCO and n = 6 for AMOX).
Figure 4. Representative Western Blot for lipolytic markers in human adipose tissue. Membranes were probed with antibodies directed against total ATGL, total HSL, phosphorylated HSL (pHSL) on Ser563 (corresponding to human Ser552) and β-actin was used as a loading control. A subset of 3 subjects per group is shown.