
Figures & data
Figure 1. AHCY inhibition and knockdown in SGBS cells impedes cell proliferation. (a) Confirmation of decreased AHCY activity after treatment with 2.5 µM adenosine dialdehyde (AdOx) compared to control treated cells (Ctr). (b) Hoechst staining of the cell nuclei and counting of number of cells on day 2, 4, 6, 8 after seeding shows a reduced number of cells after inhibition or knockdown of AHCY (representative pictures on day 4, scale bar = 1000 µm). Statistical differences were calculated using a two-way ANOVA test followed by Holm-Šídák’s multiple comparison test. (c) WST-1 assay results after four days of proliferation show that inhibition of AHCY using AdOx decreases number of viable cells. (d) LDH-Cytotoxicity assay was conducted on day 4 and shows low cell cytotoxicity (<10%) and does not differ between target cells (AdOx) and control cells (Ctr) (data shown as % of positive control (P.C.)). Statistical differences were calculated using a one-way ANOVA followed by Tukey’s multiple comparison test. (e) Inhibition of AHCY leads to reduced expression of proliferation markers CCND1 and PCNA. (f) Confirmation of AHCY knockdown using a gene specific siRNA (siAHCY) compared to non-target control siRNA (siCtr). Additional confirmation of decreased AHCY activity after knockdown of AHCY in one representative experiment with three technical replicates. (g) Cell number is reduced after knockdown of AHCY as indicated by Hoechst staining and cell counting on day 2, 4, 6, 8 (representative pictures on day 4, scale bar = 1000 µm). Statistical differences were calculated using a two-way ANOVA test. (h) WST-1 assay measurement on day 4 indicates that AHCY knockdown decreases cell number. (i) After knockdown of AHCY LDH-cytotoxicity assay shows no significant differences between siAHCY and siCtr cells (data shown as % of positive control (P.C.)). Statistical differences were calculated using a one-way ANOVA test. Unless stated otherwise, statistical differences were calculated using Student’s t-test. Results were considered statistically significant when p < 0.05 and are indicated above bar plots. Data are mean ± SEM from n = 3 independent experiments with 2-3 technical replicates each, unless stated otherwise.
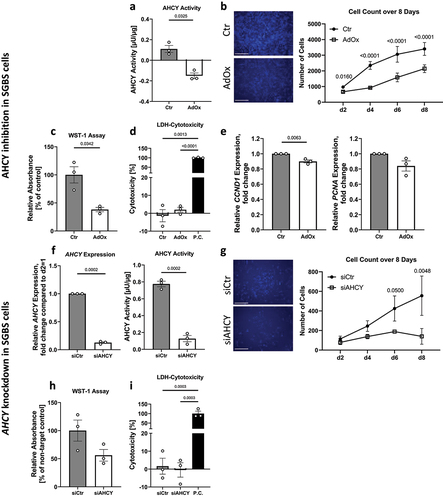
Figure 2. AHCY inhibition in human and mouse primary APCs impedes cell proliferation. (a) Confirmation of decreased AHCY activity in human primary APCs after treatment with 2.5 µM adenosine dialdehyde (AdOx) as compared to control treated cells (Ctr). (b) Inhibition of AHCY reduces number of cells as indicated by counting of Hoechst-stained cell nuclei on day 2, 4, 6, 8 of proliferation (c) WST-1 assay measurements on day 4 indicate that AHCY inhibition leads to decreased cell viability. (d) Cell cytotoxicity is low (<10%) in target cells (AdOx) and control cells (Ctr) as indicated by results from LDH-Cytotoxicity Assay from day 4 (data shown as % of positive control (P.C.)). Statistical differences were calculated using a one-way ANOVA followed by Tukey’s multiple comparison test. (e) Expression of the proliferation markers CCND1 and PCNA on day 1 of proliferation in human primary APCs shows no significant differences after inhibition of AHCY. (f) After treatment with 5 µM AdOx AHCY activity is significantly reduced in mouse primary APCs. (g) Reduced cell count of Hoechst-stained cell nuclei on day 2, 4, 6, 8 after inhibition with AdOx (representative pictures on day 4, scale bar = 1000 µm). Statistical differences were calculated using a two-way ANOVA test. (h) Inhibition of AHCY leads to significantly reduced WST-1 signal in mouse primary APCs, indicating a reduced number of cells. (i) LDH-Cytotoxicity assay shows no significant difference between AdOx and Ctr-treated cells on day 4 (data shown as % of positive control (P.C.)). Statistical differences were calculated using a one-way ANOVA test. Unless stated otherwise, statistical differences were calculated using Student’s t-test. Results were considered statistically significant when p < 0.05 and are indicated above bar plots. Data is mean ± SEM from n = 2-3 independent experiments with 2-3 technical replicates each.
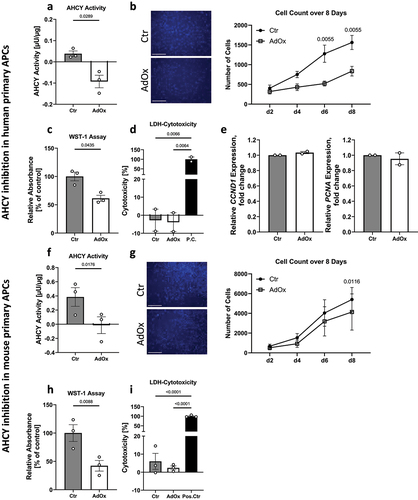
Figure 3. AHCY inhibition and knockdown reduces adipocyte differentiation capacity in SGBS cells. (a) Representative pictures after Nile Red/Hoechst (scale bar = 200 µM) and Oil Red O (scale bar = 500 µM) staining of cells on day 10 of differentiation indicate reduced differentiation rate in AdOx treated cells, as compared to control cells (Ctr) (representative area of picture enlarged in upper right corner). (b) Evaluation of Nile Red/Hoechst double staining and Oil Red O absorbance measurement on day 10 confirm that number of differentiated cells and overall differentiation capacity of SGBS cells treated with AdOx is reduced. (c) Inhibition of AHCY leads to decreased expression of adipogenic differentiation markers PPARG, FABP4, LIPE and PLIN1while there is no significant difference in the expression of reference gene SH2B1. (d) Confirmation of AHCY knockdown on day 0 and 10 of the differentiation process in SGBS cells treated with AHCY-specific siRNA (siAHCY) compared to a non-target control siRNA (siCtr) by q-PCR analysis. (e) AHCY knockdown results in slightly reduced differentiation capacity as indicated by representative pictures after Nile Red/Hoechst (scale bar = 200 µM) and Oil Red O (scale bar = 500 µM) staining of cells on day 10. (f) Percentage of differentiated cells after AHCY knockdown is significantly reduced whereas Oil Red O measurement shows a moderate tendency towards a reduced differentiation rate of siAHCY cells. Unless stated otherwise, statistical differences were calculated using Student’s t-test. Results were considered statistically significant when p < 0.05 and are indicated above bar plots. Data are presented in bar plots with mean ± SEM from n = 3-4 independent experiments with 2-3 technical replicates each.
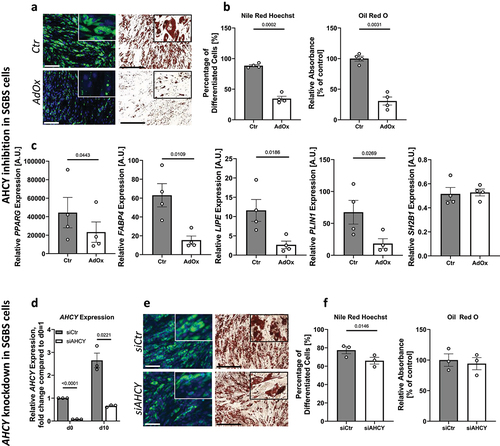
Figure 4. Reduced differentiation capacity in human and mouse primary APCs after inhibition of AHCY. (a) Nile Red/Hoechst double staining and Oil Red O staining on day 10 show that differentiation of human primary APCs is lower after inhibition of AHCY (representative pictures, scale bar Nile Red/Hoechst = 200 µM; Oil Red O = 500 µM) (representative area of picture enlarged in upper right corner). (b) Number of differentiated human primary APCs and Oil Red O absorbance is significantly reduced in cells treated with AdOx as compared to control cells (Ctr). (c) Expression of adipogenic differentiation markers PPARG, FABP4, LIPE and PLIN1 is lower in cells treated with AHCY inhibitor AdOx while the expression of reference gene SH2B1 is not significantly altered. (d) Staining of differentiated mouse primary APCs on day 10 confirm reduced differentiation capacity of AdOx treated cells (representative pictures, scale bar Nile Red/Hoechst = 200 µM; Oil Red O = 500 µM). (e) Nile Red /Hoechst and Oil Red O assessment also confirm significant reduction of differentiation rate of mouse primary APCs. (f) Expression of adipogenic markers Pparg, Fabp4, Lipe and Plin1 in mouse primary APC tend to be lower after inhibition of AHCY while no significant difference is detected in the expression of reference gene Sh2b1. Unless stated otherwise, statistical differences were calculated using Student’s t-test. Results were considered statistically significant when p < 0.05 and are indicated above bar plots. Data in bar plots are mean ± SEM from n = 2-4 independent experiments with 2-3 technical replicates each.
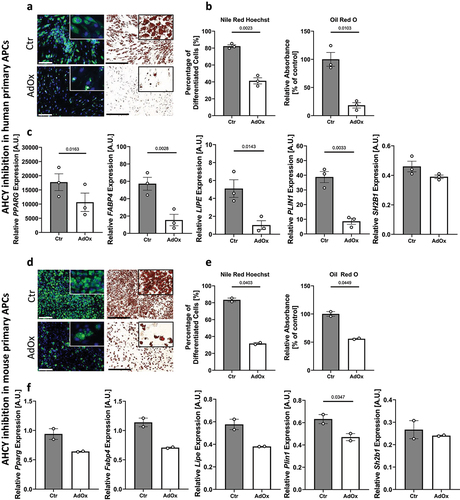
Figure 5. Expression of annotated genes after CpG methylation analysis associated with fat cell differentiation and cell growth in GO overrepresentation analysis. Expression of genes associated with fat cell differentiation (ASXL2, BNIP3, CCDC3, NR4A1, RNASEL, WIF1, WWTR1, ZADH2, STK4) and with cell growth (STK4, CDKL3, NRP1, NTRK3 and PPARA) in AdOx-treated SGBS cells (open circles) and human primary APCs (open triangles) compared to untreated control cells on day 4 of the differentiation process. For statistical analysis SGBS and human APC expression measurements were pooled. Data in bar plots are mean ± SEM from n = 2 experiments with two technical replicates each. Results were considered statistically significant when p < 0.
Table 1. Pathways with the highest enrichment of annotated genes after CpG methylation analysis as identified by GO overrepresentation analysis.
Supplemental Material
Download Zip (3.9 MB)Supplemental Material
Download MS Word (17.9 KB)Supplemental Material
Download MS Word (39.2 KB)Data availability statement
The datasets used and/or analysed during the current study are available from the corresponding author on reasonable request.