
Figures & data
Figure 1. Brown adipocyte differentiation. (a) Induction scheme of brown adipocyte differentiation in vitro from immortalized brown preadipocytes. The details of differentiation process were described under ‘materials and methods’. Created by Biorender.com. (b) Phase-contrast images of cells at day − 2, day 0, day 4, and day 8 during the differentiation process. bar: 50 µm (c) phase-contrast and oil-red-O staining images at pre- adipocytes (day 0) and mature adipocytes (day 8). bar: 100 µm (d) quantification of the relative oil-red-O absorbance between mature adipocytes and preadipocytes. (e) Norepinephrine-induced UCP1 activity on mature adipocytes. Mature adipocytes (day 8) containing Ucp1-luc were incubated with DMSO for control and norepinephrine (1 µM) for 24 hours. The luciferase activity was determined by the method described in materials and methods section. ctr: control; Nore: norepinephrine. * p < 0.05, **** p < 0.0001.
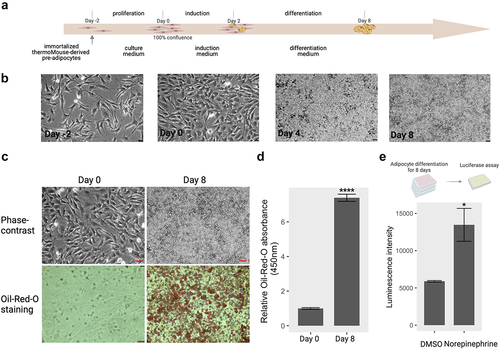
Table 1. Summary of a pair of primers for 13 reference genes and two target genes.
Table 2. The PCR amplification efficiency of reference and target genes.
Figure 2. Stability scores and ranking of 13 candidate housekeeping genes in the adipogenesis and thermogenesis panel. (a,b) Stability scores from Delta CT algorithms; (c,d) Stability scores from BestKeeper algorithms; (e,f) Stability scores from NormFinder algorithms; (g,h) Stability scores from GeNorm algorithms at an adipogenesis (left) or thermogenesis (right) panel, respectively. For the adipogenesis panel, cells were collected at day 0, day 2, day 4, and day 8 during adipocyte differentiation. For the thermogenesis panel, cells at day 0 and day 8 were treated with norepinephrine (1 µM) or DMSO and incubated for 24 hours. All experiments were performed at three biological replications. The mRNA expression of reference genes underwent examination through RT-qPCR and the RefFinder tool was utilized for calculating stability scores. Original Ct values, including biological replications, from all time points in adipogenesis condition or all treatments in thermogenesis were inputted into the RefFinder tool for analysis. The stability score of individual candidate gene, determined by each algorithm, was displayed as bar-graphs. Lower (left) and higher (right) scores indicate more and less stable genes, respectively.
Figure 3. Geometric mean of rankings (GMR) from all four algorithms scores of 13 candidate housekeeping genes in the (a) adipogenesis and (b) thermogenesis panel. The GMR values were calculated by the Refinder algorithm using the original ct values of each gene as input, considering all experimental designs. Lower (left) and higher (right) scores indicate more and less stable genes, respectively.
Table 3. The comparative summary of gene stability for 13 reference genes in the adipogenesis panel.
Table 4. The comparative summary of gene stability for 13 reference genes in the thermogenesis panel.
Figure 4. The relative gene expression of adipogenic markers based on four specific reference genes during the brown adipocyte differentiation. The relative expression levels of Ucp1 (a) and pparg (b) normalized to each reference gene (Tbp, Ubc, Rer1 and Sdha) were represented as graphs. Cells were collected at each differentiation time (day 0 (D0), day 2 (D2), day 4 (D4), and day 8 (D8)), followed by an RT-qPCR assay to assess the mRNA expression of Ucp1 and Pparg. The relative expression of the two target genes was normalized using various reference genes and calculated relative to the control. All experiments were performed at three replications. * < 0.05, ** < 0.01, *** < 0.005, **** < 0.001, ns: non-significant, p value. Orange, green, cyan, and purple represent Tbp, Ubc, Rer1 and Sdha, respectively.
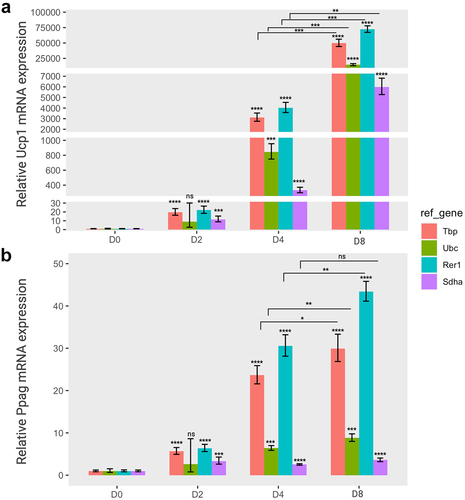
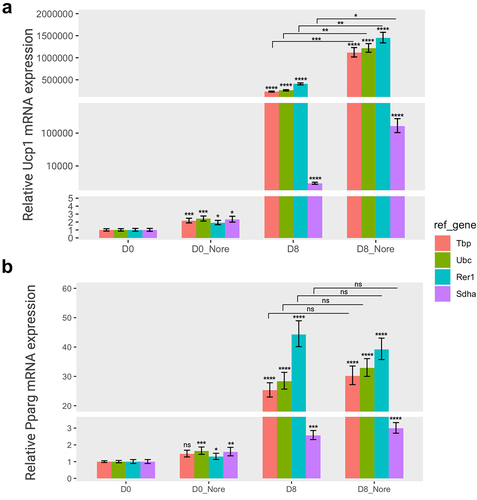
Figure 5. The relative gene expression of adipogenic markers based on four specific reference genes in norepinephrine-induced thermogenesis. The relative expression levels of Ucp1 (a) and pparg (b) normalized to each reference gene (tbp, Ubc, Rer1, and sdha) were represented as graphs. Cells were treated with norepinephrine (1 µM) or DMSO (control) at day 0 (D0, preadipocytes) and day 8 (D8, differentiated adipocytes) and incubated for 24 hours, and subsequently subjected to to RT-qPCR assay to examine the mRNA expression of Ucp1 and Pparg. The relative expression of the two target genes were normalized using various reference genes and calculated in relation to the control. All experiments were performed at three replications. * < 0.05, ** < 0.01, *** < 0.005, **** < 0.001, ns: non-significant. Nore, norepinephrine. Orange, green, cyan, and purple represent Tbp, Ubc, Rer1, and Sdha, respectively.
Supplemental Material
Download MS Word (796.8 KB)Data availability statement
The reference sequences used for designing primers in this study can be found in the NCBI Reference Sequences (NM007393.5; NM009735.3; NM001289726.2; NM010368.2; NM013556.2; NM008828.3; NM026395.2; NM009438.5; NM011296.3; NM013684.3; NM011655.5; NM019639.4; NM023281.1; NM009463.3; NM001127330.3).