Figures & data
Table 1. XXXXX.
Table 2. XXXXX.
Figure 1. Systemic administration of BG34-200 induces a potent anti-melanoma response. (A). Schedule for subcutaneous inoculation of B16F10. WT C57BL/6 mice inoculated with subcutaneously injected B16F10 and treated by PBS, BG34-10, BG34-200, BG34-500 and dextran. (B) Tumor volumes in WT C57BL/6 mice bearing established B16F10 and different treatments. Tumor volumes at preclinical endpoint (day 18) for individual animals in each group were graphed. n = 10 per group. ##p < 0.01. Significance was determined by two-way ANOVA with Student's t test. (C) Photographs of tumors of representative mouse of untreated (PBS) and BG34-200 treatment. (D) Survival of mice treated by PBS or BG34-200. (n = 10 per group). (E) Schedule for i.v. inoculation of B16F10. WT C57BL/6 mice inoculated with i.v. injected B16F10 and treated by PBS and BG34-200. (F) Photographs of lungs of representative mouse of untreated (PBS) and BG34-200-treated. (G) The number of metastatic nodules in lungs of untreated (PBS) and BG34-200-treated mouse. n = 8 per group. ##p < 0.01. Significance was determined by two-way ANOVA with Student's t test.
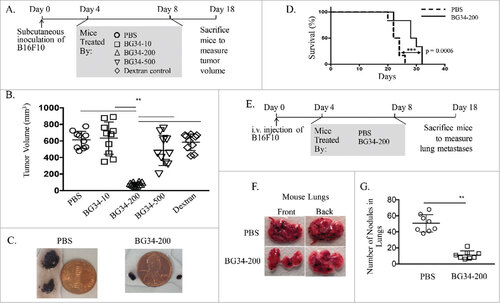
Figure 2. BG34-200 treatment promotes immune activation in the tumor site. The WT C57BJ/6 mice were inoculated with subcutaneously injected B16F10 and treated by PBS or BG34-200. Three days after treatment, tumors from PBS- and BG34-200 treated mice were harvested for FACS analysis and qPCR. (A) The frequency of tumor-infiltrating macrophage and monocytes by FACS. (B) The frequency of tumor-infiltrating granulocytes and DCs by FACS. (C) Fluorescence microscopic imaging of B16F10 tumor tissues from CD11c-venus C57BL/6 mice treated by PBS or BG34-200 (Left). Fluorescence intensity of tumors treated without BG34-200 (-BG34) and with BG34-200 (+BG34-200) (Right). Data were graphed as means ± SD. Each data point represents fluorescence intensity of one region of interest. (D) The frequency of tumor infiltrating T (CD3+) and B (CD19+) cells by FACS. (E) The frequency of tumor-infiltrating CD62L+CD44+ and CD62L-CD44+ cells in CD4+ and CD8+ populations by FACS. (F) The intracellular frequency of IFN-g and Granzyme B by CD8+ populations within tumors. (G) RNA expression in B16F10 tumor tissues from WT C57BL/6 mice treated by PBS or BG34-200. For (A), (B), (D), (E), (F) and (G), n = 9 per group. (A), (B), (D), (E) and (G) data were graphed as means ± SD. For (A), (B), (D) and (E), each data point represents pooled samples from three mice. For (G), each data point represents one of three replicates of RNA samples from individual tumor. #p < 0.05, ##p < 0.01. Significance was determined by two-way ANOVA with Student's t test.
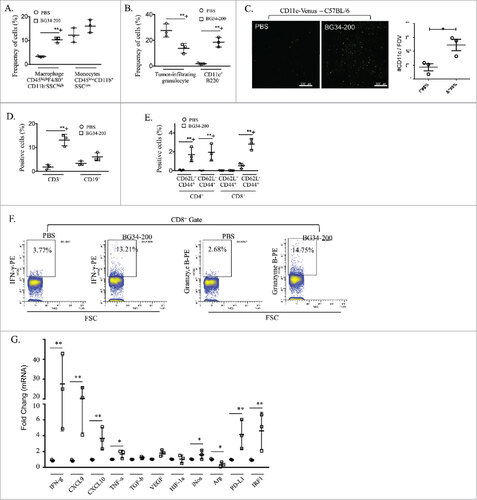
Figure 3. BG34-200 treatment augments systemic activation of T cells recognizing melanoma antigen. (A) Splenocytes or TDLN cells were stimulated with gp10025-33 peptide. IFN-g and IL-2 levels in the culture media were assessed using ELISA. B. Frequencies of CD3, CD4, CD8 T cells and their expression of CD62L and CD44 in spleen and TDLN were determined by FACS analysis. C. TDLN cells were subjected to intracellular cytokine staining for determining the frequency of gp10025-33 -specific T cells. (A) and (B) were graphed as means ± SD. Each data point represents one of three replicates of samples from individual TDLN or spleen. #p < 0.05, ##p < 0.01. Significance was determined using Student's t test.
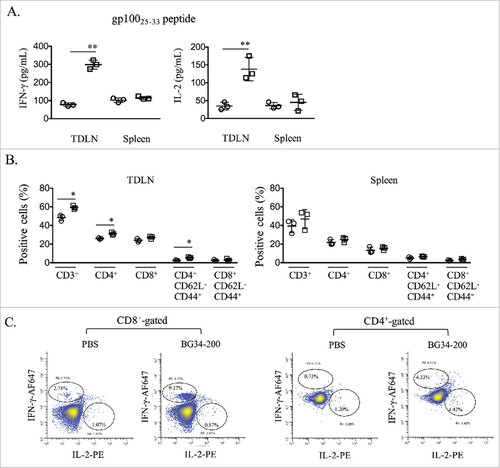
Figure 4. CD11b+ cells are required for BG34-200-induced anti-melanoma responses. (A). Bone marrow derived macrophages (BM-Ms) were cultured with BG34-200 in the presence of MCSF for 14 days. PBS-treated BM-Ms served as treatment control. The PBS- or BG34-200-treated BM-Ms were then co-cultured with FITC-conjugated latex beads to determine phagocytic activity. PBS-treated BM-Ms with no beads serve as control. Left: FACS histograms showing the frequencies of FITC+ cells in the CD11b+F4/80+-gated BM-M cell populations. Middle: Percentage of FITC+ cells in CD11b+F4/80+ BM-Ms. Right: Mean fluorescence intensity (MFI) of FITC+ cells in CD11b+F4/80+-BM-Ms. (B) Inflammatory cytokine concentration in cell conditioned media. BM-Ms were cultured with BG34-200. PBS-treated BM-Ms served as control. The PBS- and BG34-200-treated BM-Ms were then co-cultured with B16F10 tumor cells at BMM to B16F10 ratio 5:1. BM-M or B16F10 cell conditioned media served as controls. Inflammatory cytokines (TNF-a, IL-6, IL-10, MCP-1, IFN-g and IL-12p70) in cell conditioned media were determined by cytometric bead array. For (A) and (B), data were graphed as means ± SD. Each data point represents one of three replicates of samples from individual BM-M cultures. (C) Tumor volumes in WT C57BJ/6 or CD11b-KO mice bearing established B16F10 with or without BG34-200 treatment. Tumor volumes at day 12, 16 and 18 for individual animals in each group were graphed. n = 9 per group. (D) RNA expression in B16F10 tumor tissues from CD11b-KO mice treated by PBS or BG34-200. Each data point represents one of three replicates of RNA samples from individual tumor. For (A) – (D), #p < 0.05, ##p < 0.01. Significance was determined by two-way ANOVA with Student's t test.
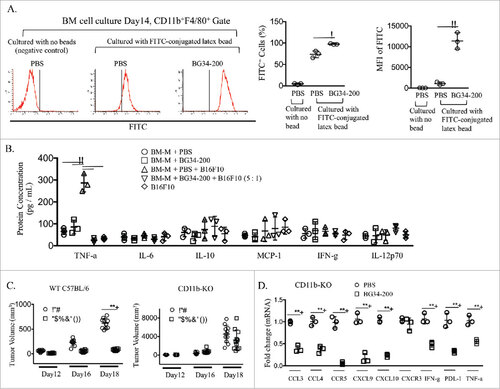
Figure 5. CD11c+ cells are required for BG34-200-induced anti-melanoma responses. (A) 3H thymidine assay of PMEL CD8+ T cells co-cultured with gp10025-33 peptide-pulsed BMDCs. T cells alone served as negative control. BMDCs were treated by PBS or BG34-200, or BG34-200-treated macrophage-conditioned medium. BMDCs pulsed with gp10025-33 peptide and co-cultured with PMEL CD8+ T cells at DC : T ratios of 1: 20, 1:10 and 1:5. (B) BG34-200-treated macrophage-conditioned medium at three different dilutions with DMEM were used to co-culture with BMDCs. Then BMDCs were pulsed with gp10025-33 peptide and co-cultured with PMEL CD8+ T cells at DC : T ratios of 1:5. (C) Tumor volumes in CD11c-KO mice bearing established B16F10 with or without BG34-200 treatment. Tumor volumes at day 12, 16 and 18 for individual animals in each group were graphed. n = 9 per group. # p < 0.05, ## p < 0.01. Significance was determined by two-way ANOVA with Student's t test.
Figure 6. Lymphocytes and IFN-g are essential for BG34-200-induced antitumor responses. (A) Tumor volumes in nude (left) and IFN-g-KO mice (right) bearing established B16F10 with or without BG34-200 treatment. Tumor volumes at different time points for individual animals in each group were graphed. n = 9 per group. (B) RNA expression in B16F10 tumor tissues from nude mice (up) and IFN-g-KO mice (down) with or without BG34-200 treatment. Each data point represents one of three replicates of RNA samples from individual tumor. # p < 0.05, ## p < 0.01. Significance was determined by two-way ANOVA with Student's t test.
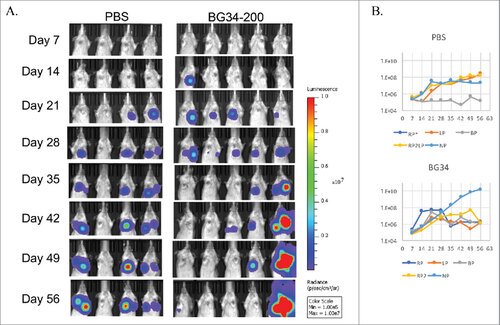
Figure 7. Systemic administration of BG34-200 induces antitumor responses in K7M2-Luc2 osteosarcoma model of Balb/c mice. Balb/c mice bearing i.v. injected K7M2-Luc2 osteosarcoma cells were administered with BG34-200 intranasal once a week for 7 weeks. PBS-treated mice bearing i.v. injected K7M2-Luc2 osteosarcoma cells served as control. Tumor volume were quantified by non-invasive imaging of luciferase signal. (A) Weekly whole body imaging of mice treated by PBS or BG34-200. (B) Mean fluorescence intensity of PBS-treated (up) and BG34-200-treated (down) mice at various time points. For PBS group, n = 4; for BG34-200 group, n = 5.