Figures & data
Figure 1. Trends in PubMed publications from 1986 to 2017 by topic. This Fig. summarizes all PubMed listed cancer immunotherapy articles grouped by category. (A) Among all cancer immunotherapy articles published in 2017, 33% referred to one or more specific chemotherapy drugs (bottom shape). This proportion was roughly constant over three decades. Contrariwise, checkpoint inhibition was almost absent before 2010, showing an accelerating growth afterwards. (B) Hematological neoplasms were the most commonly investigated immunotherapy target until 2014, when they were overtaken by gastrointestinal and skin neoplasms. (C) Among all major cell types in the tumor microenvironment, myeloid cells were rapidly gaining interest around the year 2000. Afterwards, no significant change whatsoever was observed. (D) Bivariate analysis of treatment types versus cancer types in PubMed cancer immunotherapy publications. Checkpoint inhibition shows a markedly increasing trend (“trumpet”) in skin, respiratory, but also urinary tract and gastrointestinal cancer. (A-C) + significant rise of growth rate within one year (anomaly >95%), ◊ significant decrease of one-year growth rate (anomaly < 5%).
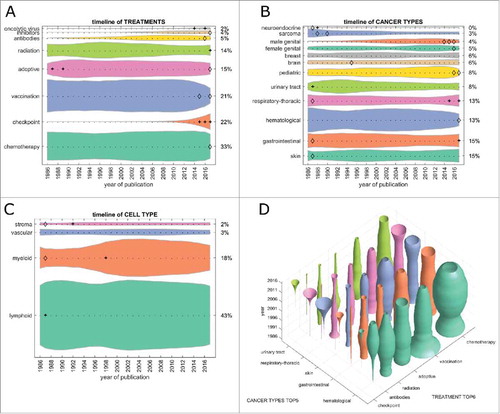
Figure 2. Trends in clinical trials from 2000 to 2017 per topic. This Fig. summarizes all registered clinical trials of cancer immunotherapy grouped by category. (A) Immune checkpoint inhibition has rapidly become the most common therapy approach between 2010 and 2017. At the same time, vaccination approaches have greatly diminished, being subject to only 9% of clinical immunotherapy trials in 2017. (B) As in PubMed publications, hematological neoplasms have markedly lost ground, yielding to gastrointestinal and respiratory neoplasms in recent years. (C) Among all major cell types in the tumor microenvironment, myeloid cells were in the focus of research interest around 2000, diminishing afterwards and only being investigated in 2% of immunotherapy clinical trials in 2017. (D) Bivariate plot of treatment types versus cancer types in cancer immunotherapy clinical trials. Checkpoint inhibition shows an increasing trend (“trumpet”) in respiratory and gastrointestinal cancer. (A-C) + significant rise of growth rate within one year (anomaly >95%), ◊ significant decrease of one-year growth rate (anomaly < 5%).
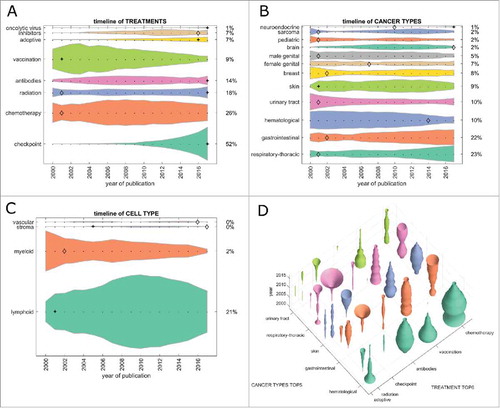
Figure 3. Emerging immunotherapy paradigms. (A) Co-occurrence of cancer immunotherapy treatment approaches in clinical trials between 2000 and 2017. On the diagonal, the development of individual treatment approaches is shown with checkpoint inhibition displaying a rapid increase. Off the diagonal, treatment combinations are shown with chemotherapy and checkpoint inhibition being the most common and rapidly growing combination. (B) This bivariate plot shows cancer immunotherapy trends grouped by translational research topics and major cancer types based on all PubMed publications between 1986 and 2017. Among signalling, stroma, apoptosis and angiogenesis, apoptosis is the most rapidly growing topic in all major cancer entities except hematological neoplasms. Stroma and signalling are most rapidly increasing in gastrointestinal cancer.
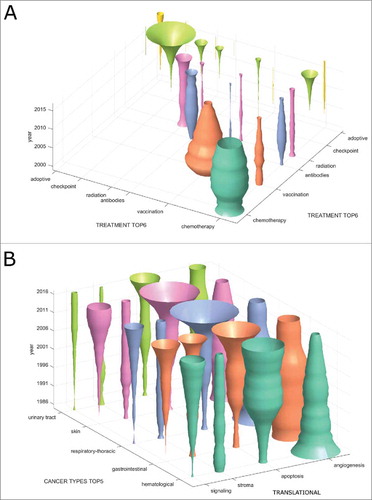
Figure 4. Translational efficiency. We asked how the number of research publications influences the number of clinical trials in subsequent years. To this end, we analyzed PubMed articles for specific fields in a five-year period (2006–2011) and evaluated the number of matching US-registered clinical trials in the following five years (2012–2016). This yields a measure of translational efficiency (clinical trials per research publication). (A) Among therapy types, immune checkpoint inhibitors had the highest translational efficiency with approximately 0.2 trials per publication. Scientific findings in vaccination and cell-based therapy were not efficiently translated to the clinic. (B) Among major tumor entities, translational efficiency was highest for gastrointestinal tumors and lowest for hematological and lymphoid malignancies (hema.). It is in the interest of the research community to increase translational efficiency in these low-performing fields.
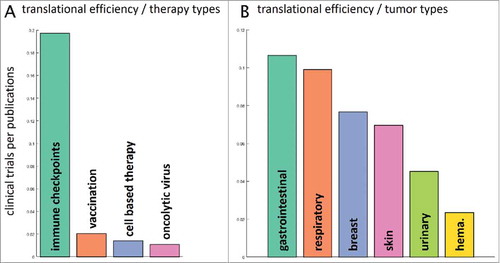
Figure 5. Clinical trial phases. This Fig. shows the development of clinical trials in phase 1/2/3 over time. (A) PubMed articles matching any clinical phase. Only a fraction of PubMed listed articles can be matched to a clinical phase and the proportions between the phases have not changed significantly in the last 20 years. (B) Clinical trials matching any clinical phase, ordered by group size, from bottom to top: phase 2, phase 1, phase 3. Some trials could be matched to multiple phases so that the percentages in 2017 do not necessarily add up to 100%. Phase 2 trials are most abundant and phase 1 trials are slowly growing, albeit not significantly. (C) In stark contrast to the slow overall growth dynamic of clinical trials in the above panels, this panel shows marked changes in clinical trials per cancer entity over time. In gastrointestinal cancer and respiratory-thoracic cancers, phase 1 and 2 trials are currently showing pronounced increase. (A+B) + significant rise of growth rate within one year (anomaly >95%), ◊ significant decrease of one-year growth rate (anomaly < 5%).
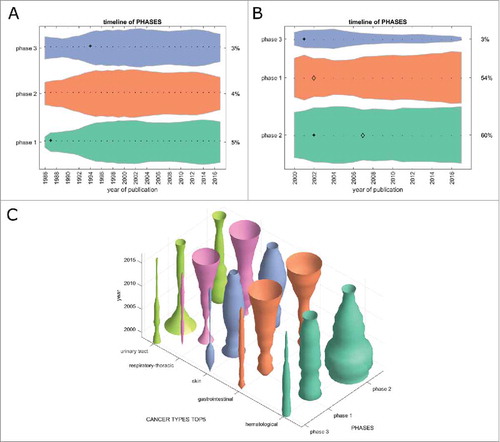
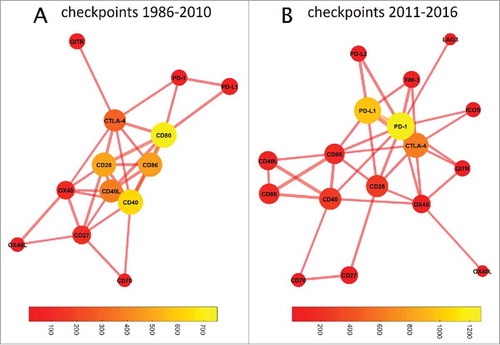
Figure 6. Graph-based analysis of immune checkpoints. In these graphs, the distance between two nodes denotes the co-occurrence while the color of the bubble denotes the frequency of occurrence (bubble sizes are log occurrence). (A) Before 2011, a cluster around CD80/CD86/CD40/CD28 dominated immune checkpoint research. (B) This has fundamentally changed since 2011: The field is now dominated by PD-1/PDL1, with CTLA-4 as a bystander. The number of relevant immune checkpoints has markedly increased. CD80 still occupies a central position in the network, linking the CD40/CD86/CD40L cluster with PD1/PD-L1/CTLA-4. TIM3 and OX40 have also moved closer to the network's core, indicating an increasing importance despite few absolute hits.