
Figures & data
Figure 1. H6 upregulates phosphorylation of STAT3 transcription factor in AGI-101H cell lines Mich1 and Mich2 that elicit expression of melanoma-initiating cell markers ALDH1, CD271, ABCB5, as well as a microphthalmia-associated transcription factor (MITF). A. Flow cytometry analysis of STAT3-pY705 and STAT3-pS727 modifications in Mich1 and Mich2 cell lines as well as their Hyper-IL6-modified derivatives. B. Flow cytometry analysis of ALDH1 activity demonstrated with Aldefluor assay. C and D. Flow cytometry analysis of CD44 (C) and CD271 (D) expression on the surface of Mich1 and Mich2 cell lines as well as their Hyper-IL6-modified derivatives. E. Western blot analysis of ABCB5 marker. F. Western blot analysis of MITF. For Western Blot assays, GAPDH was used as an internal control
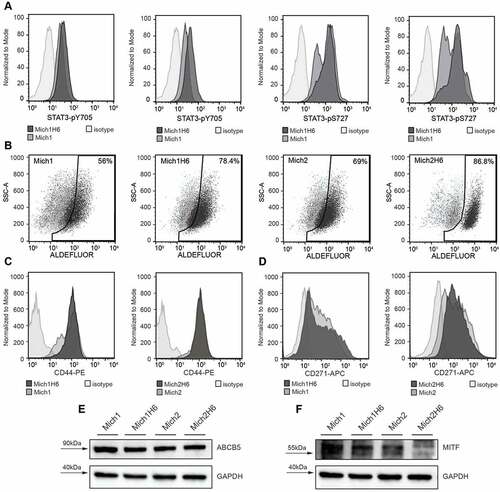
Figure 2. Immunization with AGI-101H significantly increases the frequency of ALDH1-specific CD8+ T cells. A. Representative analysis of ALDH1-specific CD8+ T cells in melanoma patient immunized with the AGI-101H vaccine. B. Cytometric data of multiparametric analysis of the frequency of ALDH1-specific CD8+ T cells performed before and after administration of single dose of AGI-101H vaccine were statistically analyzed using Wilcoxon matched-pairs signed rank test. ****p < 0.0001. Data are presented as dot plots with mean shown as a line. C. Cytometric data obtained for healthy controls (n = 10), untreated patients divided into patients with stage II-III (n = 7) and patients with stage IV (n = 17), AGI-101H-vaccinated patients (n = 39) at day 0 and at day 6, were statistically analyzed using Kruskal-Wallis test, p < 0.0001. Differences between groups were tested using Mann Whitney U test: ****p < 0.0001, ***p = 0.002, **p = 0.007, *p = 0.03. Data are presented as dot plots with mean shown as a line
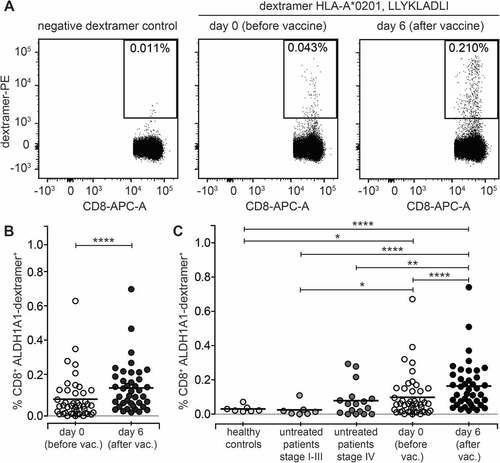
Figure 3. ALDH1A1-specific peripheral CD8+ T lymphocytes from vaccinated melanoma patients acquire Central Memory T cell phenotype (CM). A. Flow cytometry analysis of CD45RA and CCR7 cell surface markers on peripheral CD8+ T lymphocytes (not specific for ALDH1A1 (LLYKLADLI) peptide). Representative plots from AGI-101H vaccinated melanoma patient at day 0 and day 6 after vaccination are depicted. B. Percentage of defined peripheral CD8+ T cell subpopulations not specific for ALDH1A1 (LLYKLADLI) peptide in AGI-101H treated melanoma patients on the day of vaccine administration (day 0) and 6 days later. C. Flow cytometry analysis of CD45RA and CCR7 cell surface markers on peripheral CD8+ T lymphocytes specific for ALDH1A1 (LLYKLADLI) peptide. Representative plots from AGI-101H vaccinated melanoma patient at day 0 and day 6 after vaccination are depicted. D. Percentage of defined peripheral CD8+ T cell subpopulations specific for ALDH1A1 (LLYKLADLI) peptide in AGI-101H treated melanoma patients on the day of vaccine administration (day 0) and 6 days later. CM – Central Memory, EM – Effector Memory, N – Naive, EFF – Effector; **p < 0.005
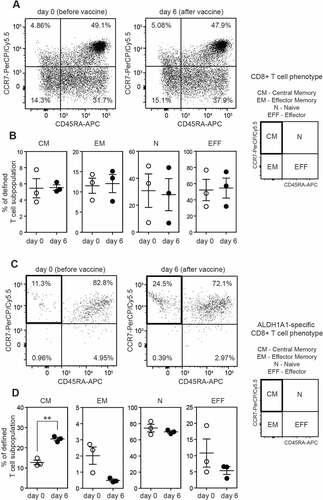
Figure 4. Functional activation of ALDH1-specific CD8+ cells in AGI-101H-treated melanoma patients upon vaccine administration. A. Representative dot plots presenting unstimulated, ALDH1A1 peptide stimulated, MAA peptides stimulated, and anti-CD3/anti-CD28 stimulated CD8+ T cells (from AGI-101H treated melanoma patient on the day of vaccine administration) stained with anti-CD107a and anti-IFN-γ. B. Representative dot plots presenting unstimulated, ALDH1A1 peptide stimulated, MAA peptides stimulated, and anti-CD3/anti-CD28 stimulated CD8+ T cells (from AGI-101H treated melanoma patient 6 days after vaccine administration) stained with anti-CD107a and anti-IFN-γ. C. Percentage of CD107a+IFN-γ+ cells in unstimulated, ALDH1A1 peptide stimulated, MAA peptides stimulated, and anti-CD3/anti-CD28 stimulated CD8+ T cells (from AGI-101H treated melanoma patient on the day of vaccine administration and 6 days later)
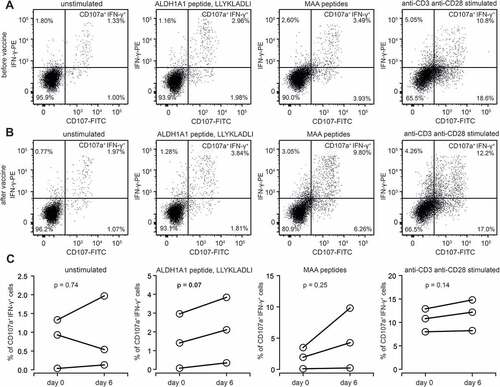
Figure 5. AGI-101H treatment decreased the number of circulating Myeloid-Derived Suppressor Cells (MDSCs) in treated patients. A. Flow cytometry analysis of MDSC cells characterized by the CD57-CD11b+CD14+HLA-DR- phenotype. Representative plots from AGI-101H vaccinated melanoma patient at day 0 and day 6 after vaccination are depicted. B. Cytometric data of multiparametric analysis of the frequency of MDSC cells obtained for healthy controls (n = 14), untreated patients (n = 20), and AGI-101H-vaccinated patients (n = 57) at day 0 and at day 6, were statistically analyzed using Kruskal-Wallis test, p < 0.0001. Differences between groups were tested using the Mann Whitney U test. Data are presented as dot plots with mean shown as a line
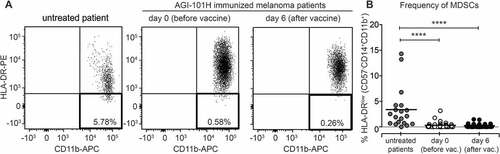
Figure 6. Immunization with AGI-101H enhances humoral response to ALDH1 antigen. The graph shows the titers of anti-ALDH1 IgG determined as the reciprocal of the highest serum dilution giving OD value at least two-fold higher than the background. Data obtained with ELISA were statistically analyzed using the Kruskal-Wallis test, p < 0.0001. Differences between groups were tested using Mann Whitney U test: ****p < 0.0001, **p = 0.0027, *p = 0.037. Data are presented as mean with SD
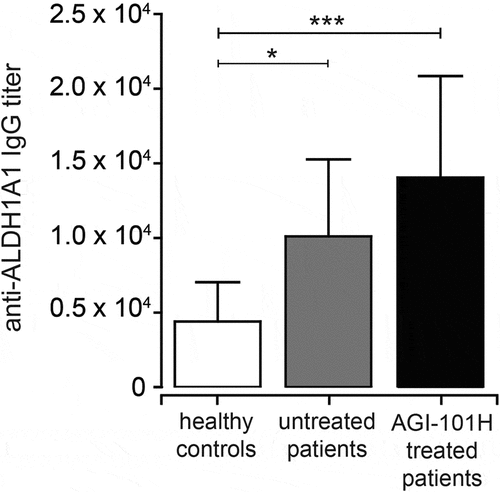
Table 1. Patients characteristics