Figures & data
Table 1. Key adjuvant chemotherapy trials in stage II colon cancer.
Figure 1. (a) Multivariable analysis of risk parameters in stage II CC patients. The size of the box represents the importance (hazard ratio) of each parameter regarding prognosis, according to current pathological parameters. (b) Multivariable analysis of risk parameters in stage II CC patients. The size of the box represents the importance (hazard ratio) of each parameter regarding prognosis, according to immuno- pathological parameters. Immunoscore (the pink zone) occupies the highest hazard ratio and revealed as the sole significant parameter in multivariable analysis, therefore being the strongest and most significant risk-parameter in stage II CC. The plain blue line of the polygon represents significance in cox multivariable analysis, specifically referring to immunoscore, while the dotted blue lines of the boxes denote non-significance for all the cited risk parameters.
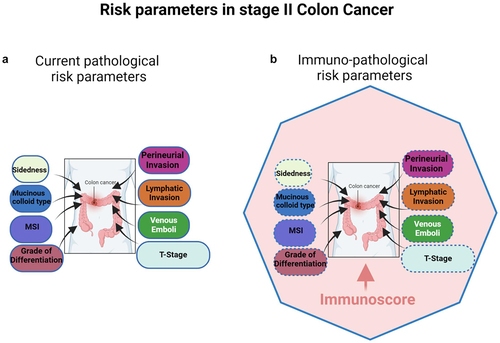
Figure 2. Agreements between pathologists’ T-score and the reference immunoscore are illustrated by Cohen’s kappa scores for 270 colon cancer patients, before and after supervised training. Kappa scores: none (0–0.2), weak (0.4–0.59), moderate (0.6–0.79), strong (0.8–0.9) and almost perfect (>0.9). IS digital pathology quantification showed almost perfect concordance (Cohen’s kappa K > 0.9) in the reproducibility. No concordance (Cohen’s kappa K < 0.25) was observed between TIL evaluated on H&E slides and immunoscore. A weak or minimal concordance (Cohen’s kappa K < 0.5) was observed between pathologists’ visual evaluation of stained CD3 and CD8 slides, both before and after training and with known IS cases. No concordance (Cohen’s kappa K < 0.12) was observed between pathologists’ visual evaluation of stained CD3 and CD8 slides, both before and after training. Each dot represents one observer. Each triangle illustrates evaluation of cases around the cut-points by one observer. Data points and kappa scores are previously described,Citation52 supplementary data.
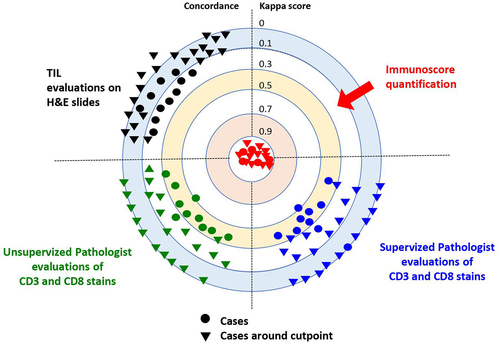
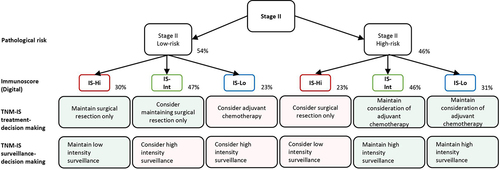
Figure 3. A decision-making algorithm for predicting treatment and surveillance in stage II Low-risk and high risk for IS-Hi, -int and -lo patients’ categories. Immunoscore (IS) could impact treatment decision-making between 23 and 48% of the patients with stage II colon cancer. Immunoscore (IS) could impact surveillance decision-making for 48% of the patients with stage II colon cancer. Visual evaluation of T-score by pathologist would lead to 70% of non concordant cases, leading to inappropriate treatment and surveillance. Percentages derive from clinical decision-tree according to IS in stage II proposed in a prior study,Citation52 supplementary data.