Figures & data
Figure 1. Illustration of best-fit model-projected age-stratified CMV seroprevalence in the US population vs. the corresponding nationally-representative NHANES III CMV seroprevalence data (A). Model-based force of infection (FOI: per susceptible risk of infection per year) as a function of age corresponding to best model-data fit in (A) (B).
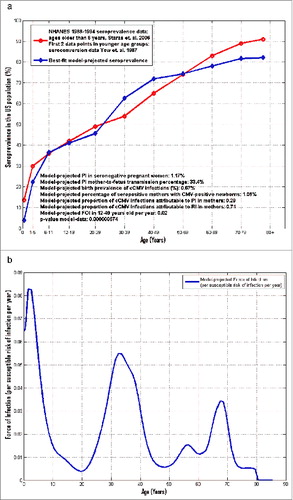
Table 1. Vaccine scenarios
Figure 2. Model-projected congenital CMV infection birth prevalence over time post-vaccination of seronegative adolescent females without booster, with one-time catch-up in 10–17 y old at start-up, under scenario 1 in the base-case vaccination framework (no vaccine impact on reactivation).
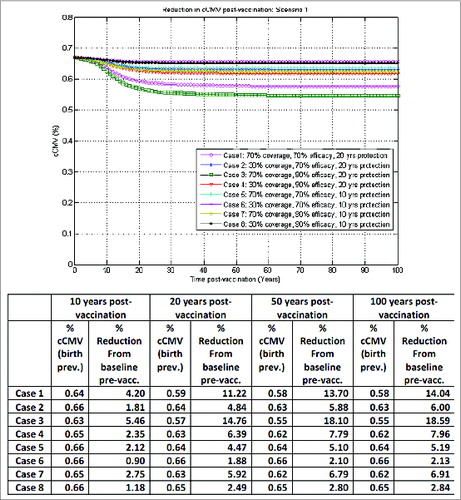
Figure 3. Model-projected congenital CMV infection birth prevalence over time post-vaccination of seronegative adolescent females with booster, one-time catch-up in 10–17 y old at start-up, under scenario 3 in the base-case vaccination framework (no vaccine impact on reactivation).
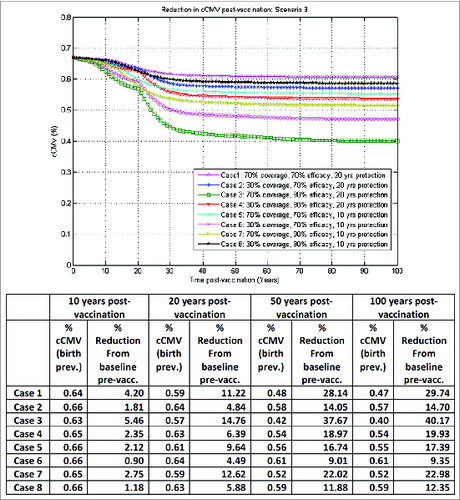
Figure 4. Model-projected congenital CMV infection birth prevalence over time post-vaccination of both seronegative and seropositive adolescent females without booster, one-time catch-up in 10–17 y old at start-up, under scenario 2 in the optimistic vaccination framework (with vaccine impact on reactivation).
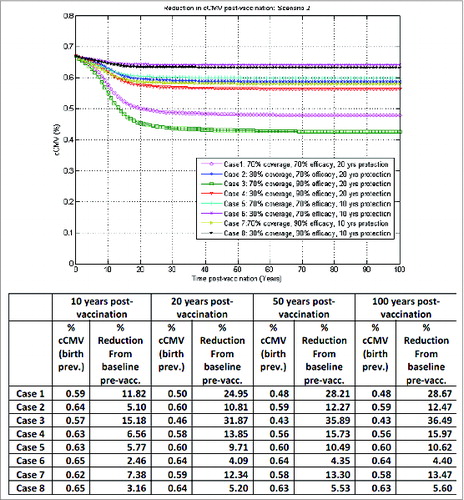
Figure 5. Model-projected congenital CMV infection birth prevalence over time post-vaccination of both seronegative and seropositive adolescent females with booster, one-time catch-up in 10–17 y old at start-up, under scenario 4 in the optimistic vaccination framework (with vaccine impact on reactivation).
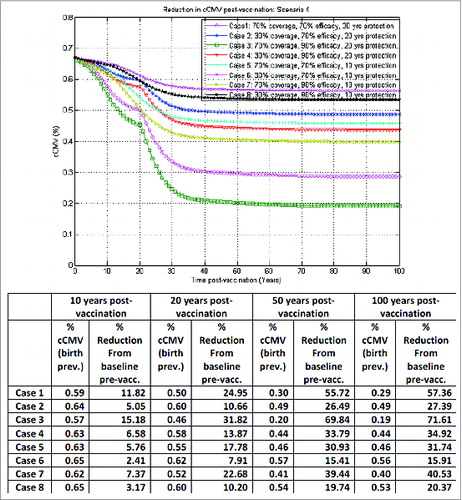
Figure 6. Model-projected congenital CMV infection birth prevalence over time post-vaccination of infants, without booster and without catch-up, under scenario 5 in the base-case vaccination framework (no vaccine impact on reactivation).
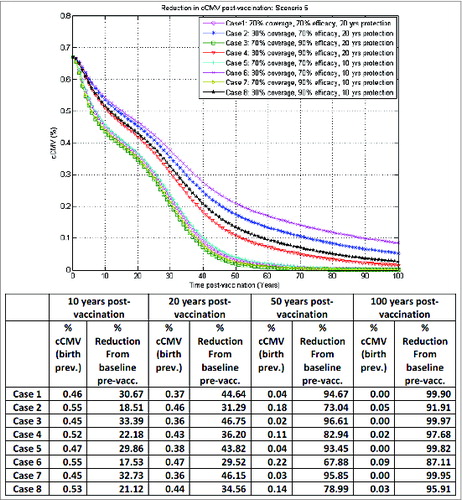
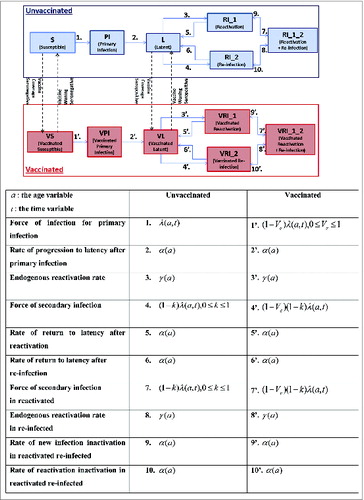
Figure 7. Model structure with compartments, states and flows. Details are given in the accompanying table below the figure.