Figures & data
Figure 1. Construction, purification and identification of the recombinant fusion protein CTT3H. The gene encoding the polyprotein CTT3H composed of 5 antigens CFP10, TB10.4, TB8.4, Rv3615c, and HBHA of M. tuberculosis was cloned into pET30b, resulting in the recombinant plasmid pET30b-CTT3H (A). The constructed recombinant plasmid pET30b-CTT3H was verified by enzyme digestion with NdeI and XhoI (B). pET30b-CTT3H transformed E. coli BL21(DE3) strain was induced with IPTG. The expression and purification process of polyprotein CTT3H was monitored and confirmed by 12% SDS-PAGE, respectively (C). Lane M, Pre-stained protein ladder of Fermentas; Lane 1, pre-induced; Lane 2, post-induced; Lane 3 and 4, flow-through fraction of His-bind resin; Lane 5 and 6, fraction eluted with 500 mM imidazole, Lane 7, the final products. The purified polyprotein CTT3H was also confirmed by western blotting with an anti-His 6 mouse monoclonal antibody or a mouse polyclonal serum against CTT3H, respectively (D).
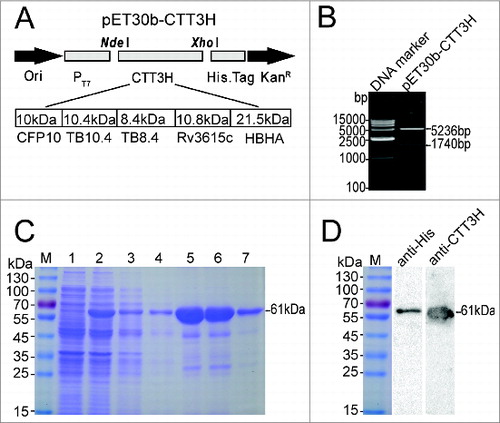
Figure 2. Bacterial loads per organs and representative lung pathology of different vaccinated C57BL/6 mice. Three weeks after the last immunization, C57BL/6 mice (n = 6) were challenged by Glas-Col inhalation exposure system with 60 CFU virulent M. tuberculosis H37Rv strain, which was confirmed by plating lung homogenates one day after infection. Four weeks post-challenge, bacterial load of lung and spleen in different groups was enumerated. Results were shown as mean ± SEM log10CFU/organ (n = 6). Lung tissue sections from different vaccinated mice were stained by HE (scale bar, 400 μm) and acid-fast staining (AF, scale bar, 50 μm), respectively. Arrows indicate AF positive bacteria. Pathological scores were calculated as described in the section of Materials and Methods in detail. ─ means P < 0.05.
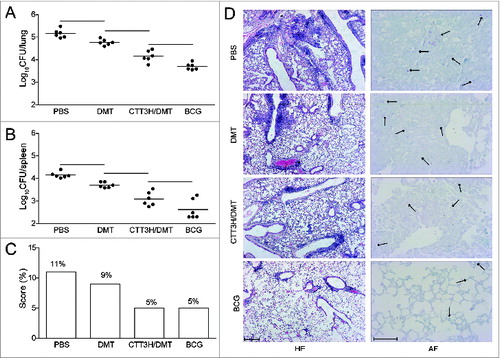
Figure 3. The levels of serum IgG, IgG1, and IgG2a antibodies against CTT3H in different groups (n = 3). Three weeks after the last immunization, anti-CTT3H IgG, IgG1, and IgG2a (replaced by IgG2c) antibody titers in individual samples from different vaccinated C57BL/6 mice were determined by ELISA. The results were shown as mean (±SEM) log10 endpoint titers and the ratio of IgG2a/IgG1 of different vaccinated groups (n = 3). ─ means P < 0.05. This experiment was repeated twice with similar results.
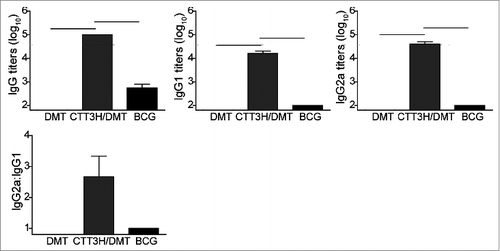
Figure 4. The levels of PPD and CTT3H specific IFN-γ secreted by splenocytes from different groups (n = 3). Three weeks after the last immunization, splenocytes were obtained from each mouse in different groups and 5 × 10⁶ cells were added into each well of 24-well microtiter plate and incubated with CTT3H protein (10 μg), PPD (10 μg), and complete RPMI-1640 medium at 37°C in 5% CO2 for 72 h. The concentration of IFN-γ in the suspension was detected by ELISA. The results were shown as mean ± SEM (pg/mL). ─ means P < 0.05, and * means PBS vs. other groups P < 0.05. This experiment was repeated twice with similar results.
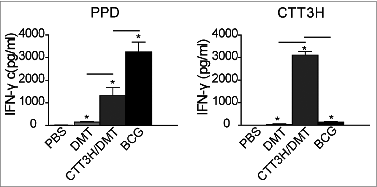
Figure 5. The levels of IFN-γ, TNF-α, and IL-2 secreted by CD4+ and CD8+ T cells in response to CTT3H (10 μg/mL) from different vaccinated mice were analyzed by multicolor flow cytometry (n = 3). The cytokine profile in individual cells was measured by multicolor flow cytometry by gating for CD4+ T cells or CD8+ T cells. The expression of IFN-γ, TNF-α, and IL-2 by T cells in response to either PPD or CTT3H (10 μg/mL) from different vaccinated mice was expressed as mean ± SEM (n = 3). ─ means P < 0.05, and * means PBS vs. other groups P < 0.05. This experiment was repeated twice with similar results.
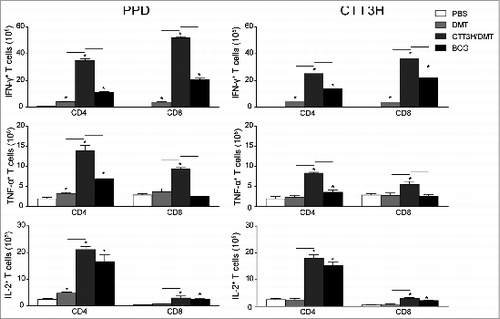
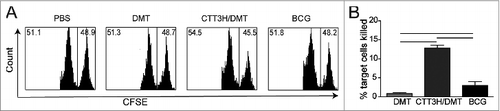
Figure 6. TB10.4 CD8+ peptide-pulsed, CFSE-labeled target cells were analyzed for in vivo CTL activities from different immunized C57BL/6 mouse (n = 3). Representative histograms of the peptide-pulsed splenocyte targets with the right and left peaks being CFSE-labeled TB10.4 peptide-pulsed splenocytes and unpulsed splenocytes analyzed by a flow cytometer, respectively (A). The results are expressed as the mean (±SEM) of 3 mice per group (B). ─ means P < 0.05. This experiment was repeated twice with similar results.