Figures & data
Figure 1. Islet autoantigenic multipeptides plus CsA induces Tregs and inhibits Teff immune response in prediabetic NOD mice. (a) The prediabetic NOD mice were injected with GAD-IN (20 μg each) and CsA (10 μg) or with controls on days 0, 6, and 12 s.c. The freshly isolated T cells from pancreatic LN on day 14 after the immunizations were in vitro stimulated with autoantigenic peptides (10 μg/ml each) for 8 h before performing antibody staining for gating strategy. The stimulated T cells were divided into two parts, the first part was gated on CD25+ and Foxp3+ to represent Treg cells, its percentage of Tregs (b) and levels of inhibitory cytokine expressions of IL-10 (c), TGF-β (d) and proliferative maker ki67 (e) were done by intracellular staining and measured by flow cytometry; the second part as autoreactive CD4+ T cells were also intracellularly analyzed their cytokine expressions for IFN-γ (f & g), TNF-α (F & H) and IL-2 (F & I). *, p value <.5, **, p value <.1, and ***, p value <.05.
Figure 2. Islet autoantigenic peptides plus CsA prevents T1D in prediabetic NOD mice. The blood glucose level of mice more than 15 mmol/L was identified as euglycemia mice. (a) The incidence of euglycemia from those immunized groups was monitored throughout the course of study. (b) The blood glucose levels were assessed after fasting 5 h in the GAD-IN+CsA vaccinated group (n = 12), compared with control groups including the GAD-IN alone (n = 12), the CsA alone (n = 12), or the vehicle (n = 12) every three days. (c) OGTT was performed to evaluate the islet function in these four groups at day 30 after the first vaccination. “*”, “#” and “Δ” represented the p values compared between the GAD-IN+CsA and GAD-IN alone, CsA alone or vehicle group, respectively. (d) Histopathological analysis of insulitis in H&E-stained sections of islets of isolated among the groups. (e) The degrees of insulitis were assessed in the four groups and percentages representing severity of insulitis was given accordingly. Each column represents a mean of 100 islets examined in five mice in each group. (f) Immunohistochemistry for infiltrating CD4+ T cells in pancreas sections was detected. Arrows indicate positive-stained cells.
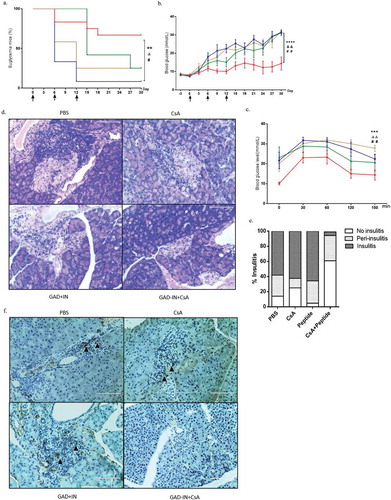
Figure 3. CsA modulates DCs as IL-10hiCD40lo phenotypic tolDC in vitro. CD11c+ DCs isolated from splenocytes of BALB/c or DO11.1 mouse were stimulated with 20 μg/ml of OVA323-339 peptide plus various concentrations of CsA, OVA323-339 alone, or vehicle for 6 h in vitro, respectively. LPS at 0.5 μg/ml was used to serve as a positive control. The stimulated DCs were performed a flow cytometry analysis on the level of intracellular cytokine IL-10 (a) and surface costimulatory markers CD40 (b) and CD86 (c). Data represent three independent experiments. *, p value <0.5, **, p value <0.1, and ***, p value <0.05.
Figure 4. TolDCs foster naïve T cells into Tregs and prevent antigen-specific Teff cells response in vitro. Fresh isolated splenic DCs were used to incubate with 20 μg/ml OVA323-339 plus 10 μg/ml CsA, OVA323-339 alone, CsA alone, or PBS for 4 h. After incubation, DCs were washed with PBS for three times, and seeded with co-cultured CD4+CD25− T cells obtained from OVA-immunized D011.10 mice in presence of IL-2. The ratio of DCs to CD4+CD25− T cells was the 1:10 for 72 h in vitro co-culture system. CD4+CD25− T cells were also set without DCs, but with coated anti-CD3 and anti-CD28, and soluble IL-2, TGF-β as differentiation control. Naive T cells were supplied with IL-2 as vehicle control. The percentage of CD4+Foxp3+ Tregs of total CD4+ T cells were detected after the co-culture (a & b). An ability to proliferate was assessed by measuring the level of ki67 expression on these CD4+Foxp3+ Tregs (a & c), or on Teffs (CD4+CD25+Foxp3−) (d & e). The functional cytokines IFN-γ (f), TNF-α (g) and IL-2 (h) of Teffs were further characterized by intracellularly staining after treated with Brefeldin A for 6 hr. Anti-CD3/anti-CD28 plus IL-2 activated T cells were stimulated with PMA and Ionomycin for last 6 h as positive control for these cytokines detection. Data represent three independent experiments. *, p value <0.5, **, p value <0.1, and ***, p value <0.05.