Figures & data
Table 1. Characteristics of OsCYPs proteins in rice under
Figure 1. Chromosomal distribution of rice OsCYPs in the rice genome. The scale on the right side is corresponding to the length of each chromosome.
Figure 2. Phylogeny of CYPs in different plant species. An unrooted phylogenetic tree was generated with 1,000 bootstrap replicates and a p-distance method in the MEGA7 program using protein-coding sequences of CYPs from Arabidopsis, Solanum tuberosum, and Populus trichocarpa.
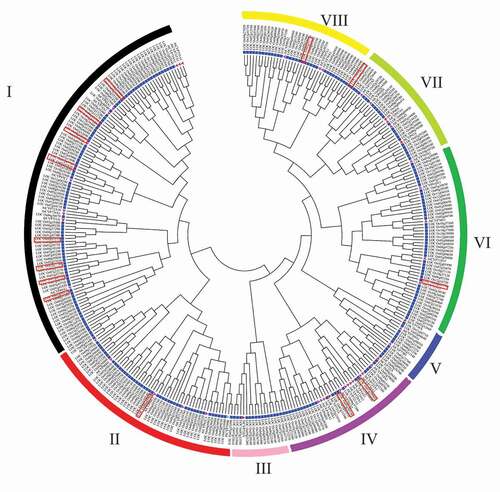
Table 2. Methylation (5mC) status of identified P450s under salt and osmotic stresses in rice
Figure 3. Correlation analysis between DNA methylation and genes (CYPs) expression (a) correlation under salt stress (b) correlation between DNA methylation and gene expression under osmotic stress. The X-axis indicates the level of methylation, while Y-axis is the gene’s expression. Each point in the graph represents a specific gene of P450.
Figure 4. Heatmap of tissue-specific expression of CYPs in different parts of the rice plant, including root, stem, leaf, panicles, and node. All the values are logCitation2 transformed. The red and blue color is corresponding to high and low expressions.
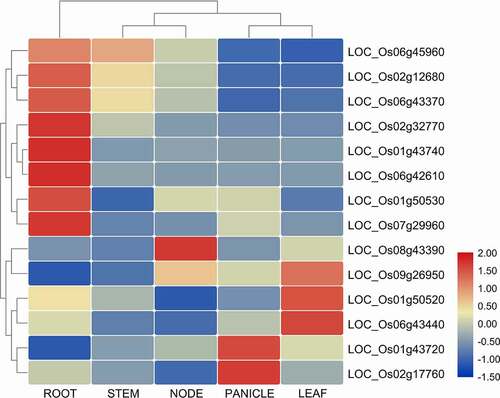
Figure 5. Heatmap of expression patterns of 14 OsCYPs under (a) abscisic acid (ABA), (b) indole-3-acetic acid (IAA), and (c) gibberellins (GA3) at 0 h, 3 h, 6 h, 12 h, and 24 h after treatment. The expression was determined relative to expression at 0 h. The red and blue color is corresponding to high and low expressions. All the values are log2 transformed.
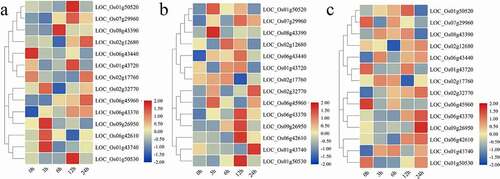
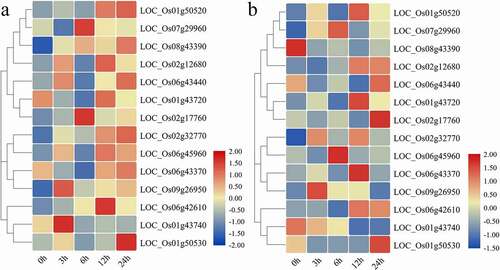
Figure 6. Heatmap of expression patterns of 14 OsCYPs under (a) salinity (b) Drought stresses at 0 h, 3 h, 6 h, 12 h, and 24 h after treatment. All the values are log2 transformed. The expression was determined relative to expression at 0 h. The red and blue color is corresponding to high and low expressions.